National data shows York workers’ wages up 13% in the last year

Figures out today (29 October) report a 13% increase in average weekly earnings for York workers* over the last year, according to government data.

The national government Annual Survey of Hours and Earnings (ASHE) – the most accurate way of estimating pay – showed that the average weekly earnings for York residents also rose from £512.60 in 2018 to £574. 60; an increase of 12%.

The wage increase in York compares favourably to other areas across the UK, with pay across the country increasing by 2.8%; a 1.9% increase for Leeds residents and an increase of 3.5% across the Leeds City Region.

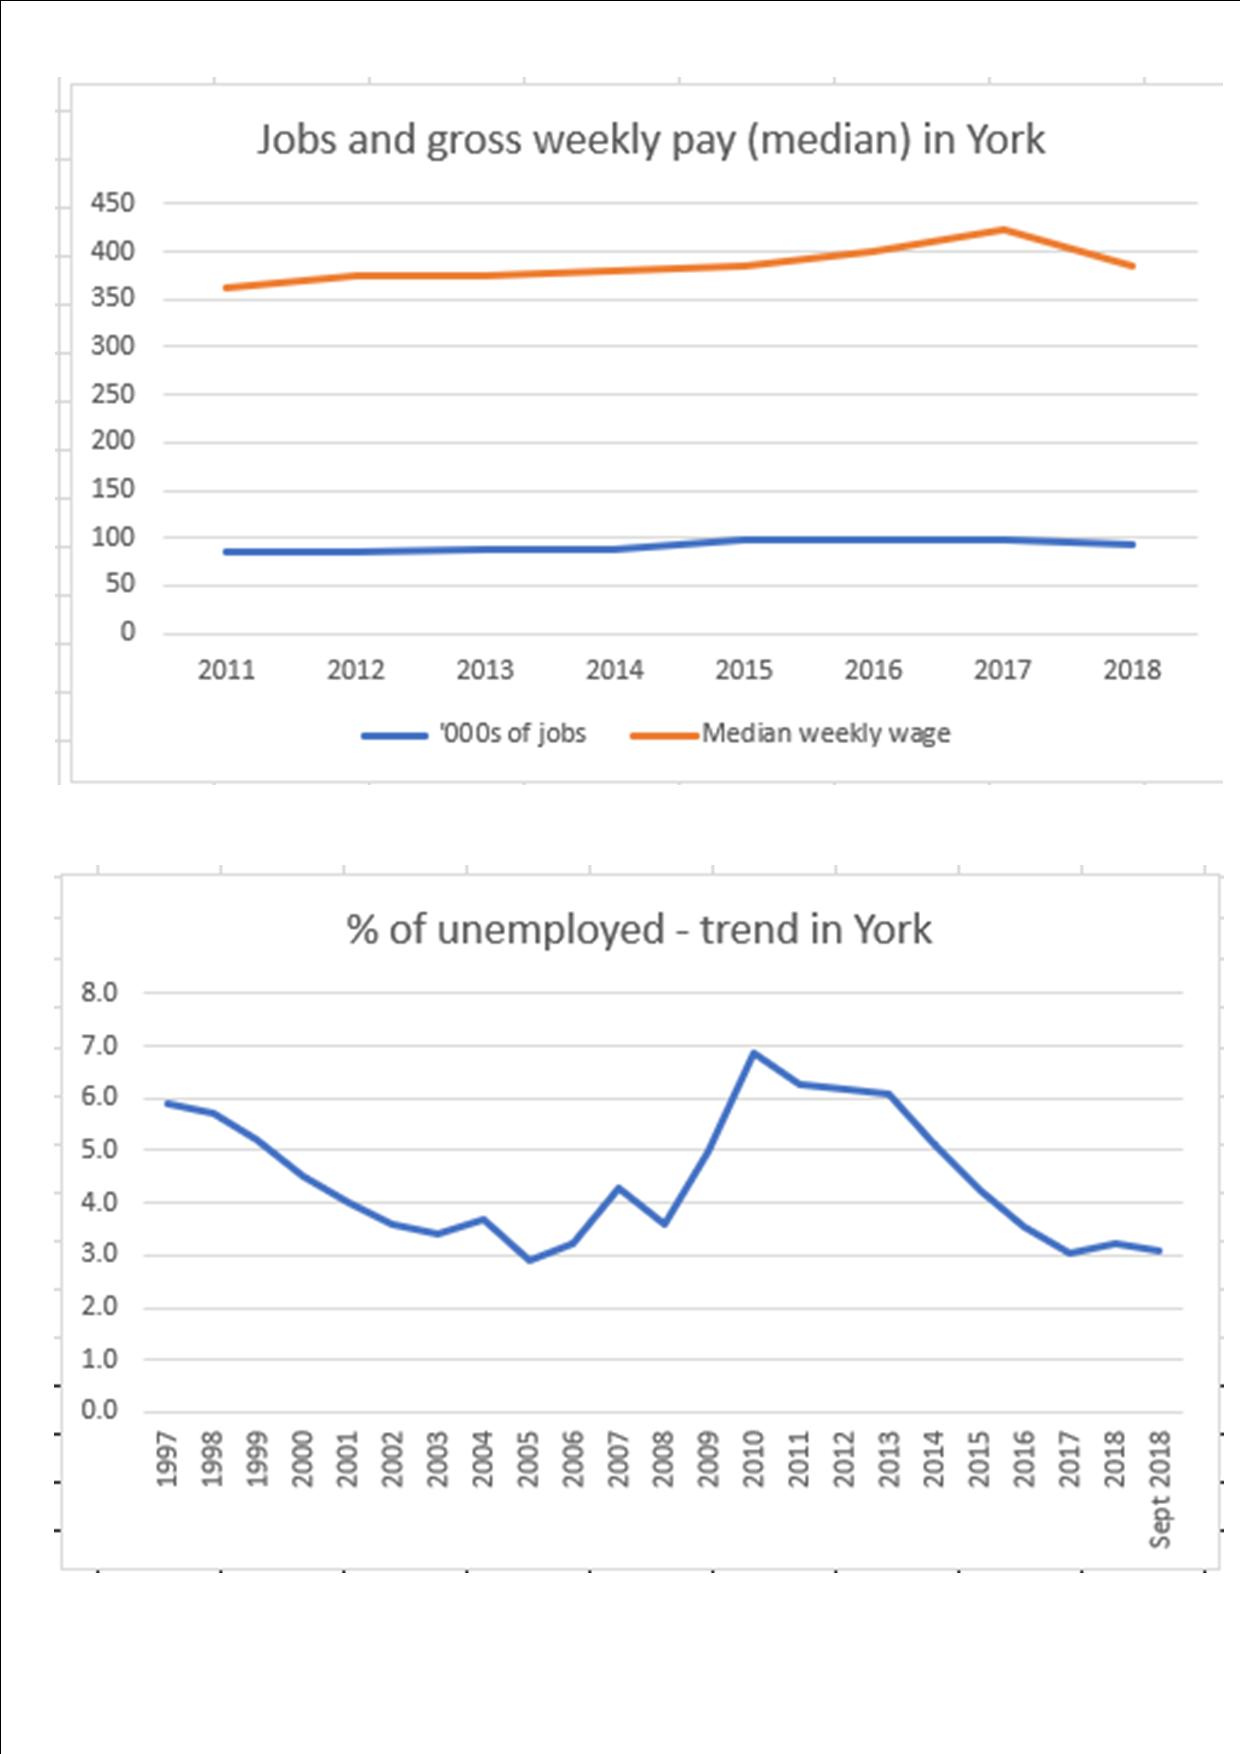
The figures correct the impression of a significant dip last year.

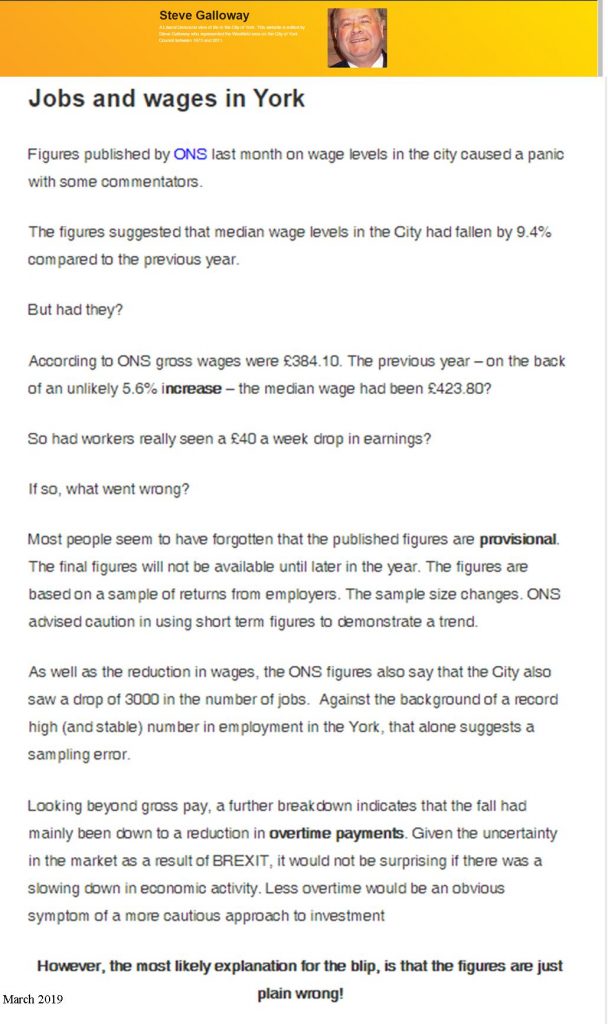
We pointed out in March that this figure was probably wrong and so it has proved to be.

Cllr Andrew Waller, Executive Member for Economy and Strategic Planning, City of York Council, said:

“These figures are welcome news for the city, though like any statistics they only show part of the picture. Looking at the data over the last five years shows, since 2015, a 16 % increase in the wages of both residents and people working in York.

This is good news for everyone in the city and shows the inherent strength of York’s economy”.


*York workers are people working in the city, not necessarily those who live in the city (York residents)

Jobs and wages in York

Figures published by ONS last month on wage levels in the city caused a panic with some commentators.

The figures suggested that median wage levels in the City had fallen by 9.4% compared to the previous year.

But had they?

According to ONS gross wages were £384.10. The previous year – on the back of an unlikely 5.6% increase – the median wage had been £423.80?

So had workers really seen a £40 a week drop in earnings?

If so, what went wrong?

Most people seem to have forgotten that the published figures are provisional. The final figures will not be available until later in the year. The figures are based on a sample of returns from employers. The sample size changes. ONS advised caution in using short term figures to demonstrate a trend.

As well as the reduction in wages, the ONS figures also say that the City also saw a drop of 3000 in the number of jobs.  Against the background of a record high (and stable) number in employment in the York, that alone suggests a sampling error.

Looking beyond gross pay, a further breakdown indicates that the fall had mainly been down to a reduction in overtime payments. Given the uncertainty in the market as a result of BREXIT, it would not be surprising if there was a slowing down in economic activity. Less overtime would be an obvious symptom of a more cautious approach to investment

However, the most likely explanation for the blip, is that the figures are just plain wrong!

Source ONS

New ONS figures highlight housing issues in York

Figures published today by the Office of National Statistics (ONS) confirm that house price inflation in York is outstripping increases in wage levels.

House price trends to 2014

The ratio of median house prices to salary levels now stands at 9.4, the highest ever recorded.

To some extent this reflects a drop in median earnings in the City over the last few years. Media earnings are now £20,648 compared to the peak of £21,130 which was seen in 2010.

House prices started to rise again about 18 months ago and now stand at a median of £194,000 which compares to the 2007 peak of £179,995.

York is the 140th most expensive place to rent a house out of a total of 326 local authorities in England and Wales. 

The average monthly rent is £675, which is  less than Harrogate where the figure is £695 a month.

Scarborough is the sixth lowest place to rent in England (£433 pm) while Hull is the cheapest at £365 pm

A resident, on a median monthly income of £1721, in York could spend 40% of it on renting private accommodation.

Those in social housing fare better with weekly rent levels being £89.87.

85% of housing stock in York is privately owned.

In terms of house building, York has performed poorly over the last 5 years coming 268th out of 326 local authorities.

As a percentage of the existing stock growth rates have been:

  • 2010 0.70%
  • 2011 0.50%
  • 2012 0.34%
  • 2013 0.28%
  • 2014 0.26%

On social housing York has a relatively low shortfall in provision at 13.9% of existing stock compared to most other areas. The worst area is Medway at 239.1%

The statistics suggest that the York Council and its partners have work to do to increase housing supply in the City while also trying to increase relative salary levels.