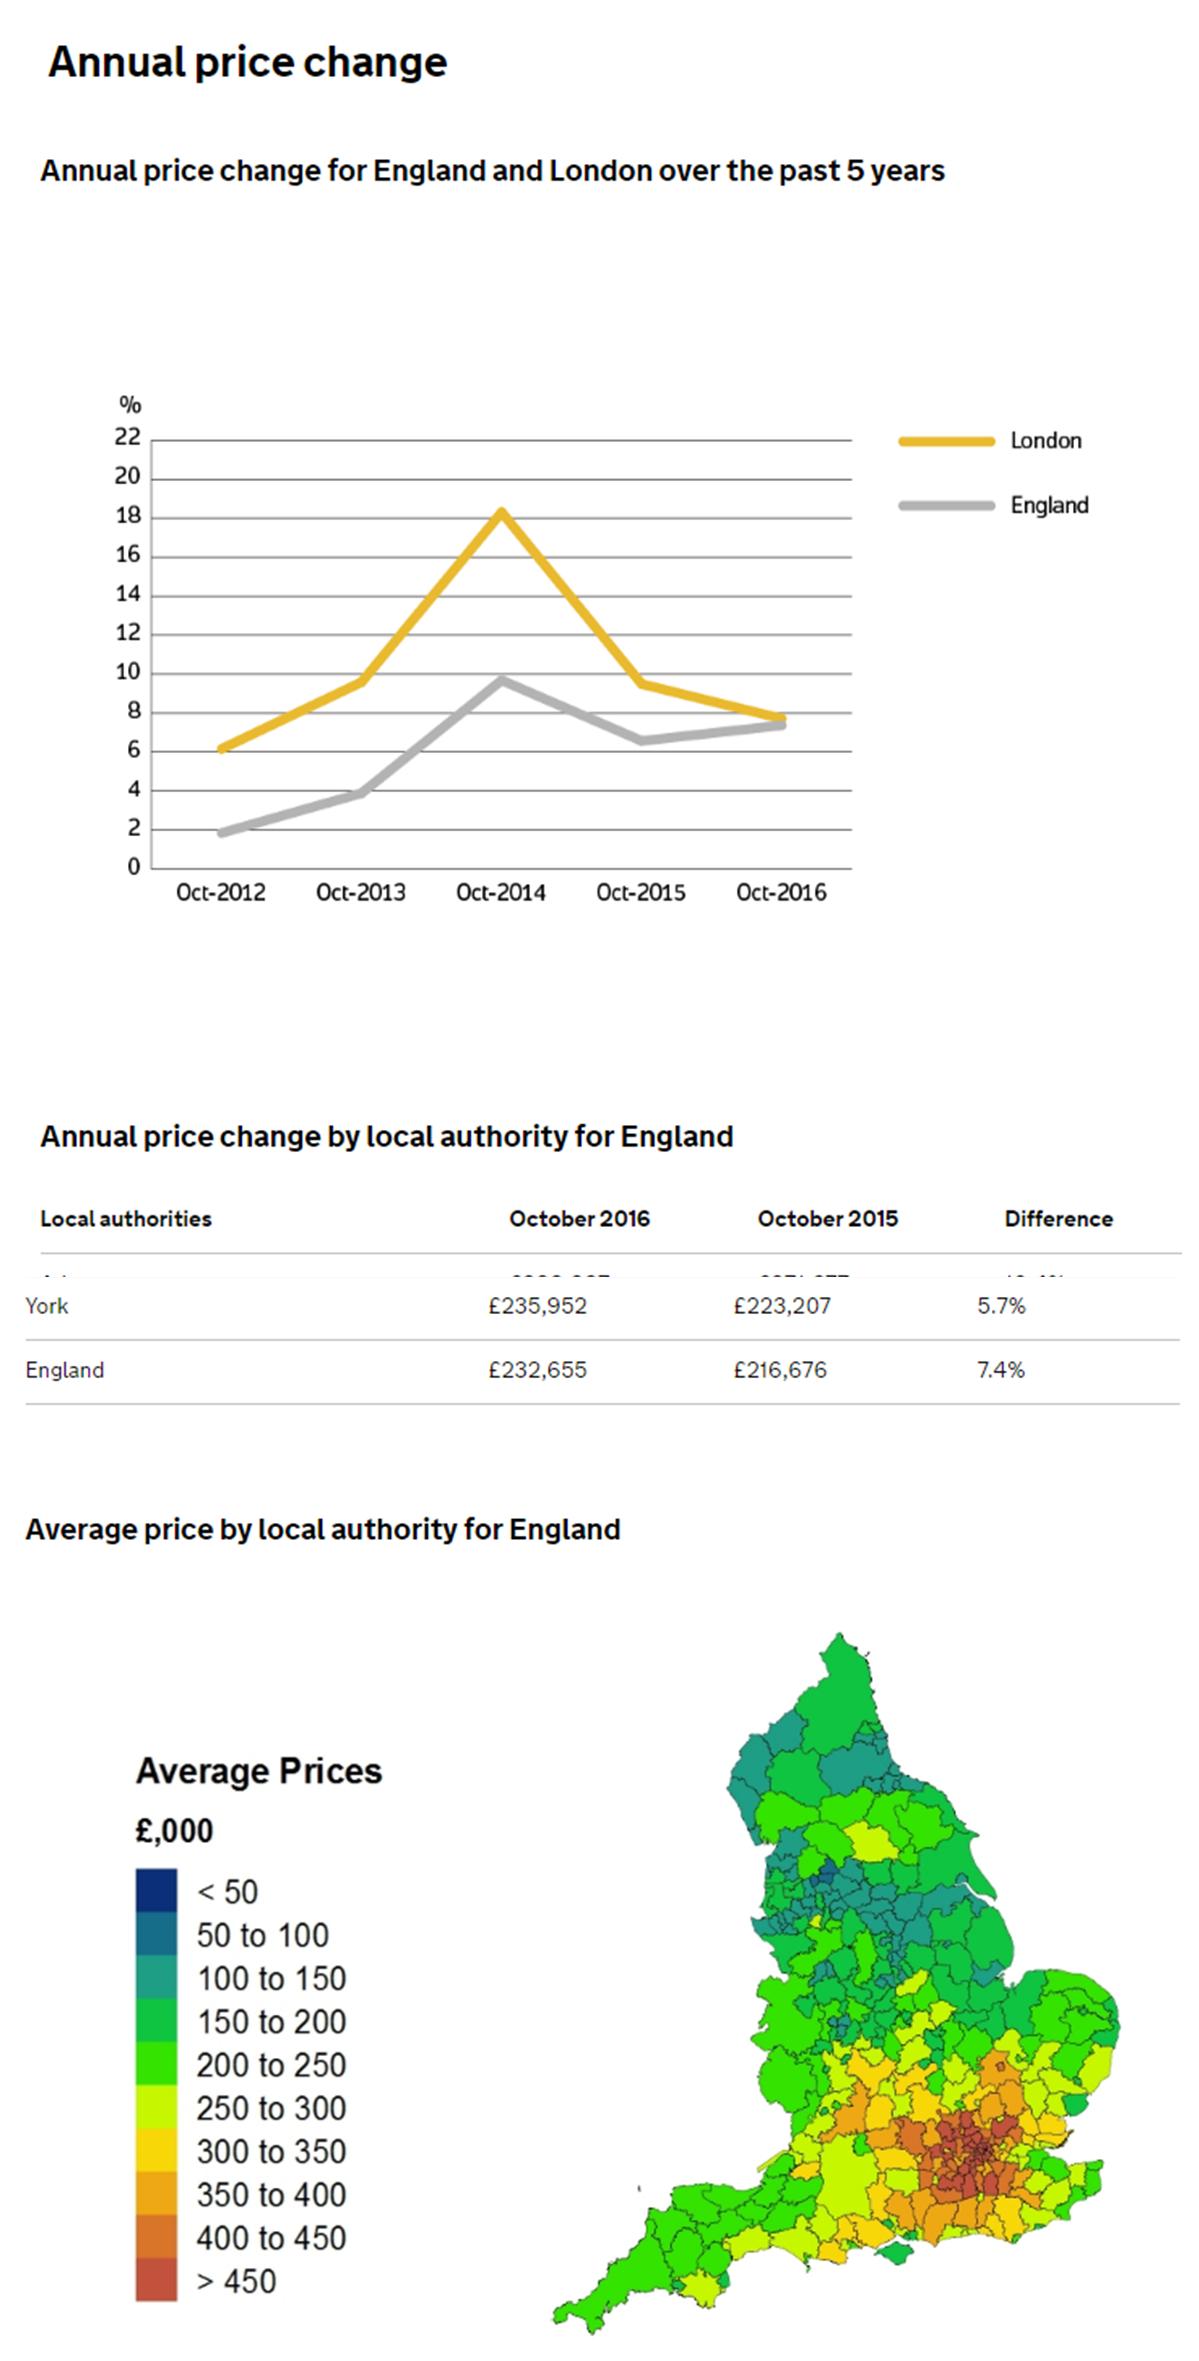
Figures published today by the Office of National Statistics (ONS) confirm that house price inflation in York is outstripping increases in wage levels.
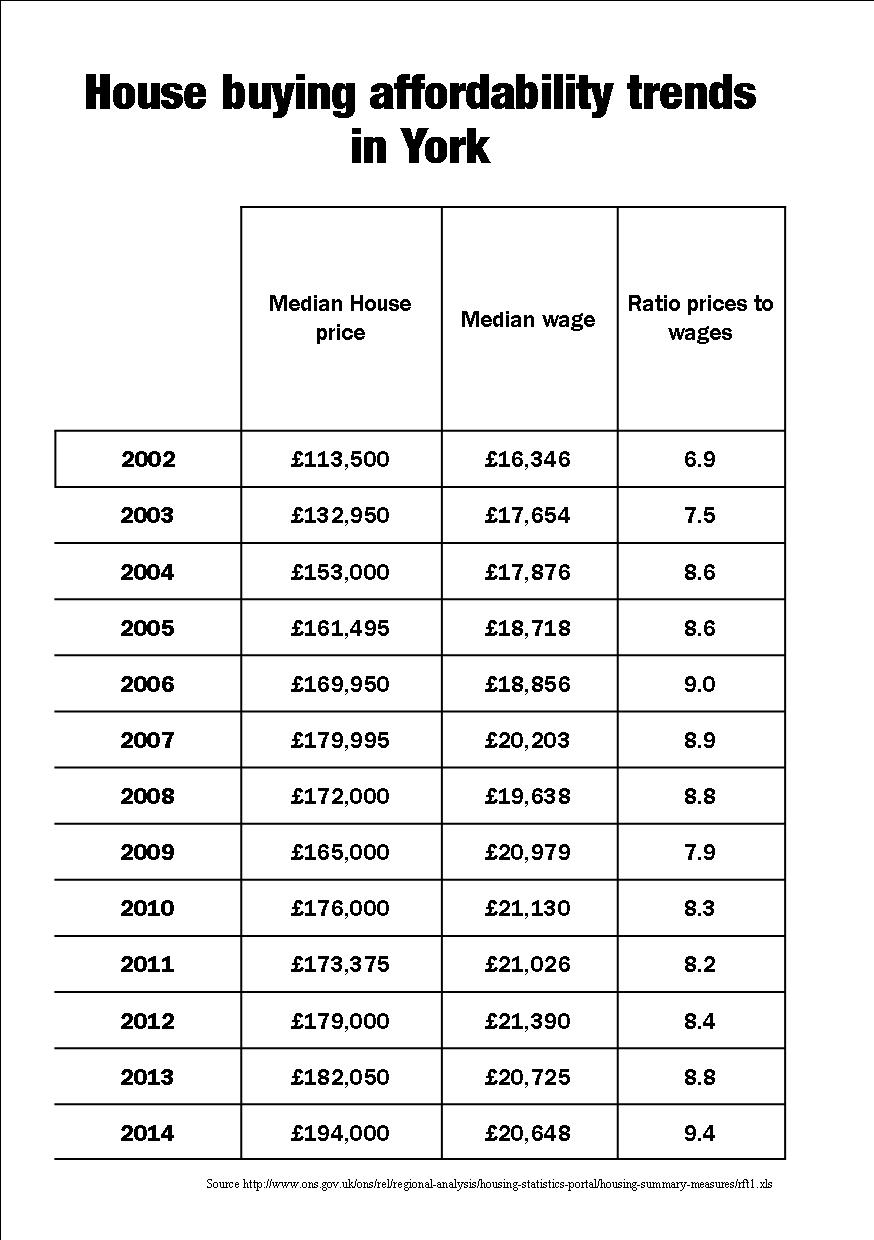
The ratio of median house prices to salary levels now stands at 9.4, the highest ever recorded.
To some extent this reflects a drop in median earnings in the City over the last few years. Media earnings are now £20,648 compared to the peak of £21,130 which was seen in 2010.
House prices started to rise again about 18 months ago and now stand at a median of £194,000 which compares to the 2007 peak of £179,995.
York is the 140th most expensive place to rent a house out of a total of 326 local authorities in England and Wales.
The average monthly rent is £675, which is less than Harrogate where the figure is £695 a month.
Scarborough is the sixth lowest place to rent in England (£433 pm) while Hull is the cheapest at £365 pm
A resident, on a median monthly income of £1721, in York could spend 40% of it on renting private accommodation.
Those in social housing fare better with weekly rent levels being £89.87.
85% of housing stock in York is privately owned.
In terms of house building, York has performed poorly over the last 5 years coming 268th out of 326 local authorities.
As a percentage of the existing stock growth rates have been:
- 2010 0.70%
- 2011 0.50%
- 2012 0.34%
- 2013 0.28%
- 2014 0.26%
On social housing York has a relatively low shortfall in provision at 13.9% of existing stock compared to most other areas. The worst area is Medway at 239.1%
The statistics suggest that the York Council and its partners have work to do to increase housing supply in the City while also trying to increase relative salary levels.