
Deaths and test results
THREE (3) additional deaths announced by the York Hospital Trust today. One occurred on Tuesday, two on Wednesday and one yesterday. The cumulative second wave hospital death toll has now reached 126.

FIFTEEN (15) additional positive test results announced today. Brings cumulative total to 6020
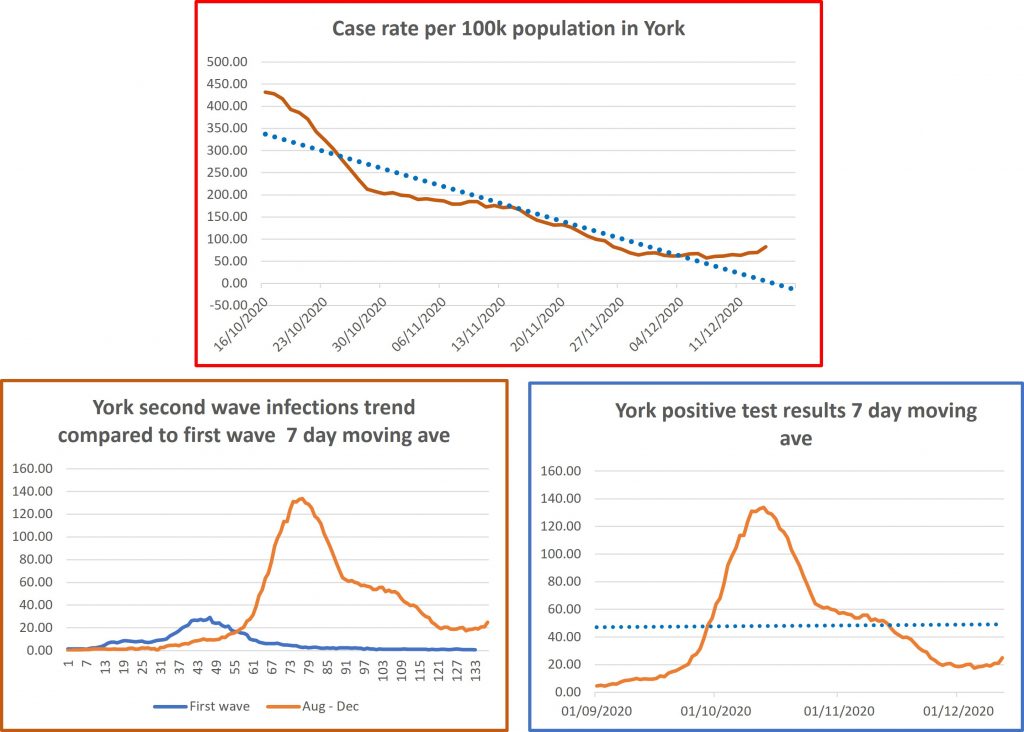
The rate /100k population figure has risen to 69.32. That is the highest level seen since 28th November.
It is expected to trend up to at least 83.0 during the next couple of days.
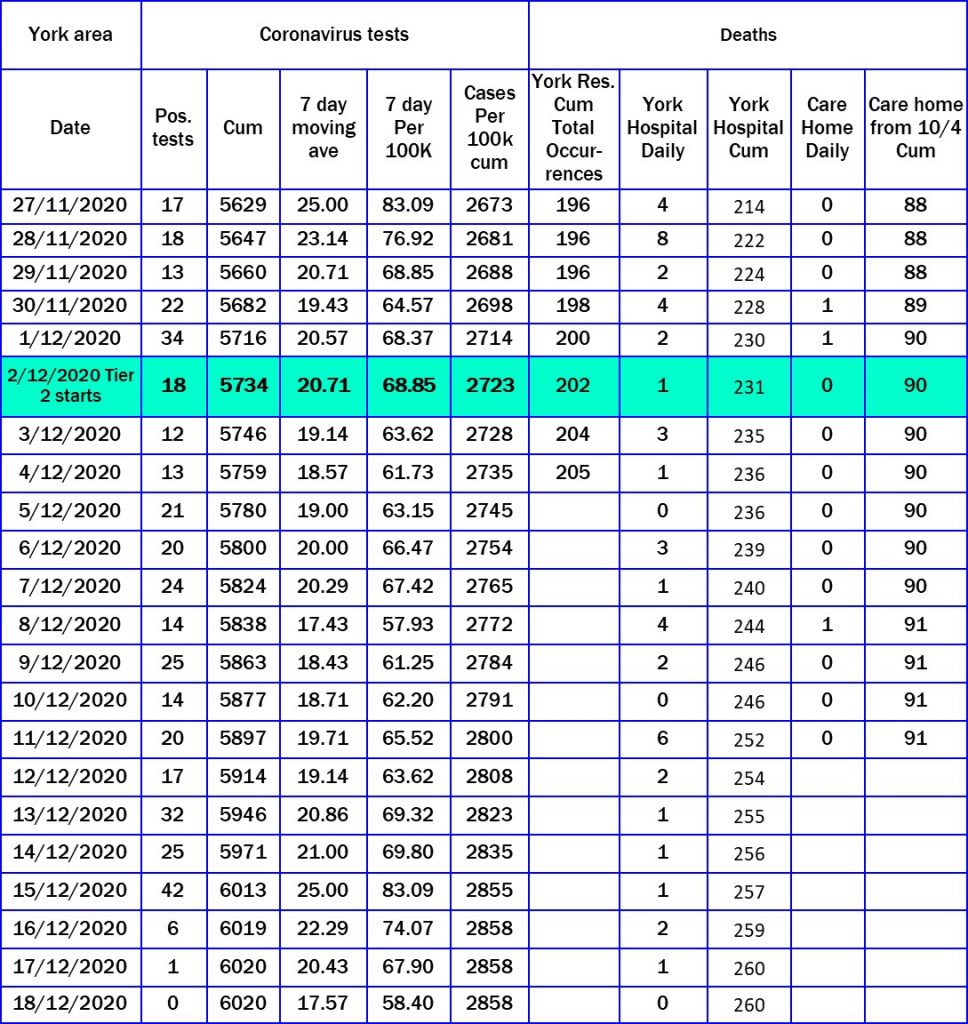
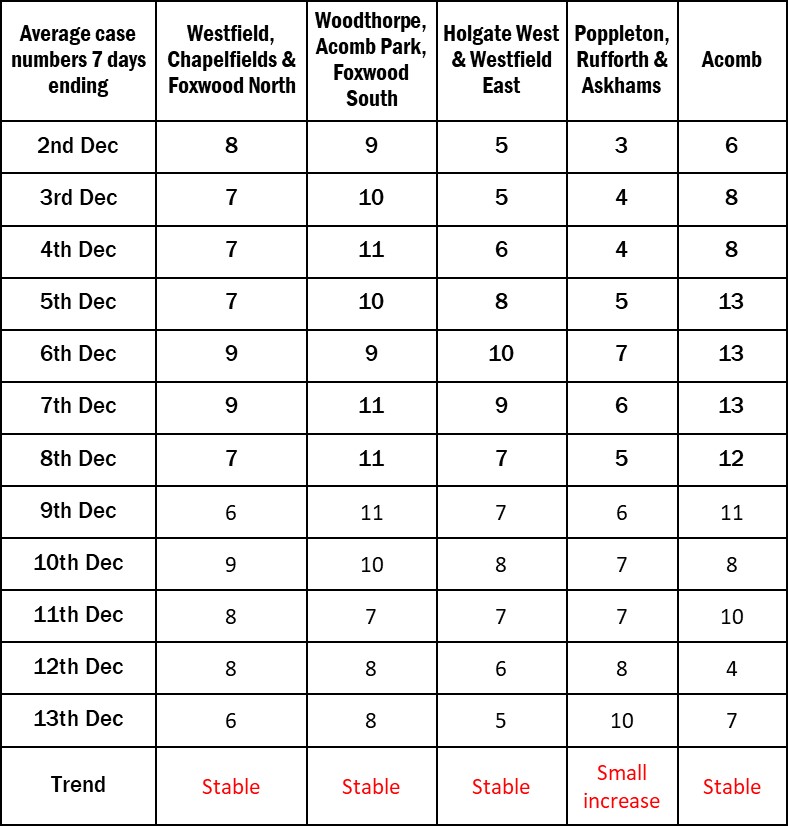
The neighbourhood Figures reveal that, for the first time since 21st November, no areas have fewer then 3 COVID cases.
Case rates are volatile at a local level and may reflect transient household infections

York Council commentary on pandemic
The York Council has updated its “open data” commentary on the pandemic.
People with Covid Symptoms
• NHS Pathways/111 triages – as at 14.12.20 there had been 121 total covid triages in the CYC area in the last 7 days. The peak number of triages was 653 in the 7 day period to 20.9.20.
• As at 16.12.20, the Covid Symptom App estimates 354.8 per 100,000 in York with symptomatic covid (responses from a sample of 4,540 people). The peak rate was 1,116.3 on 31.10.20.
Diagnosed cases (Pillar 1&2 combined)
• As at 17.12.20 York has had 6,005 cases since the start of the pandemic, a rate of 2,851.1 per 100,000 of population. The cumulative rate in York is below the national (2,957.2) and regional (4,246.6) averages.
• The PHE ‘Exceedance’ rating compares the no. of new cases over a 14 day period with the previous 6 weeks and provides a RAG rating to indicate if the previously observed trend in the no. of new cases is worsening. The latest rating for York (14.12.20) is Amber.
• The provisional rate of new Covid cases per 100,000 of population for the period 9.12.20 to 15.12.20 in York is 78.3 (using data published on Gov.uk on 17.12.20).
• The latest official “validated” rate of new Covid cases per 100,000 of population for the period 6.12.20 to 12.12.20 was 63.6. The national and regional averages at this date were 206.6 and 151.1 respectively (using data published on Gov.uk on 17.12.20).
• The rate of new Covid cases per 100,000 of population for the period 6.12.20 to 12.12.20 for people aged 60+ in York was 52.4. The national and regional averages were 138.5 and 131.5 respectively.
• The positivity rate in York had fallen since a peak of almost 18% in mid-October down to less than 2% in early December. As at 14.12.20, the latest 7 day positivity rate in York (Pillar 2 only) was 2.87%. The national and regional averages are 8.1% and 6.5% respectively. The breakdown for York over the last 7 days by type of test is 128 positives out of 3,021 lab based (PCR) tests (4.24%) and 0 positive out of 1,435 rapid (lateral flow) tests (0%).
• As at 17.12.20 York University reported 7 individuals within the University community who were currently self-isolating because they have had a positive COVID-19 test. The peak number was 331 on the 19.10.20.
• As at 14.12.20 York St. John reported 1 individual within the University community who was currently self-isolating because they have had a positive COVID-19 test. The peak number was 82 on the 8.10.20.
Contact Tracing
• Since 28.5.20 a total of 4,866 laboratory confirmed CYC Covid cases have been uploaded into the NHS Test and Trace system and 4,298 of the cases have been completed (88.3%). 13,580 ‘contacts’ have been identified and 8,339 of these have been completed (61.4%). Source: PHE Report.
• Local Tracing of Cases: Between 22.10.20 and 11.12.20, 361 ‘actionable’ positive COVID-19 CYC cases have been referred to the local contact tracing service. 360 of the referrals (99.7%) have been actioned and 1 is still ‘in progress. Of the referrals actioned, 263 (73.1%) were successful and 97 (26.9%) were unable to be reached via phone or home visit, but guidance leaflets were posted where possible.
Cases in Residential Settings / Schools
• As at 16.12.20 there were 2 care homes in the CYC area with confirmed Covid-19 infection (at least 1 case of either a staff member or resident).
• The latest ‘outbreak’ (2+ cases) in a residential care setting in York was reported by PHE on 16.12.20 (1 home – not an elderly person’s setting).
• In the 7 days up to 13.12.20 there were 11 children of primary and secondary school age who tested positive (across 9 different schools).
COVID Bed Occupancy in York Hospital
• As at 16.12.20 there were 41 confirmed Covid-19 patients in General and Acute beds. The previous figure on 15.12.20 was 34.
• As at 16.12.20 there were 3 confirmed Covid-19 patients and 0 suspected Covid-19 patients in the Intensive Treatment Unit. The previous figures on 15.12.20 were 3 and 0 respectively.
• As at 16.12.20 there had been 0 patients admitted with suspected Covid-19 and 0 with confirmed Covid-19 in the previous 24 hours.
Recovery from Covid-19
• Between 13.4.20 and 13.12.20, 264 CYC residents had recovered and been successfully discharged from York hospital after needing NHS care for symptoms linked to covid-19 infection. 7 people were discharged in the most recent week.
R Number
• The ‘R’ value (the number of people that one infected person will pass on a virus to, on average) for the North East and Yorkshire area on 11.12.20 was estimated to be in the range 0.7 to 0.9. The previous estimate was (0.7 to 0.9) on 4.12.20.
Deaths
The two sources about deaths from Covid-19 at LA level are ONS data and local registrar data. They are derived from the same source (civil registration data). ONS data is more comprehensive as it includes deaths of York residents which have occurred and been registered outside York. Local registrar data is useful as it provides a breakdown by age and gender. The most recently available data is summarised below:
• ONS weekly data: For deaths occurring up to 4th December 2020 and registered up to 12th December 2020, 205 Covid-19 deaths were recorded as having occurred for CYC residents (99 in hospital, 89 in care homes, 12 at home and 5 in a hospice). The number of deaths per 100,000 of population in York is 97.33 which is lower than the national average of 116.54. There have been 33 Covid-19 deaths of CYC residents reported by ONS in the last 9 weeks (Weeks 41 to 49).
• ‘Excess’ deaths – all causes (ONS). Between week 2 and week 49 there were a total of 138 ‘excess deaths’ in York compared with the average weekly numbers for 2014-2018. The breakdown over the year so far is: 19 fewer deaths in weeks 2-14, 210 more deaths in weeks 15-21 (when covid deaths were at their peak) and 53 fewer deaths in weeks 22-49.
• Local Registrar data: In the weekly data received on 14.12.20 (for deaths occurring up to 9.12.20), a cumulative total of 198 deaths of CYC residents where COVID-19 was mentioned (confirmed or suspected) on the death certificate, have been registered. The average age of the people who died was 82.4, with an age range of 53-104. The age profile of those dying in York is older than the national average. 97 of the 198 were male (49%), less than the national average (55.4%). 83 people (41.9%) died in nursing /care homes; (the national average is 26.53%). In addition 16 people (8.08%) who normally resided in nursing/care homes in the CYC area, died in hospital.
Test numbers and positivity
The government have published updated figures which show the number of COVID tests carried out in York. During the week ending 9th December 6674 P1/P2 test were carried out. 3380 lateral flow tests were conducted. The percentage testing positive was 2.17%.
This is the lowest level seen since September.
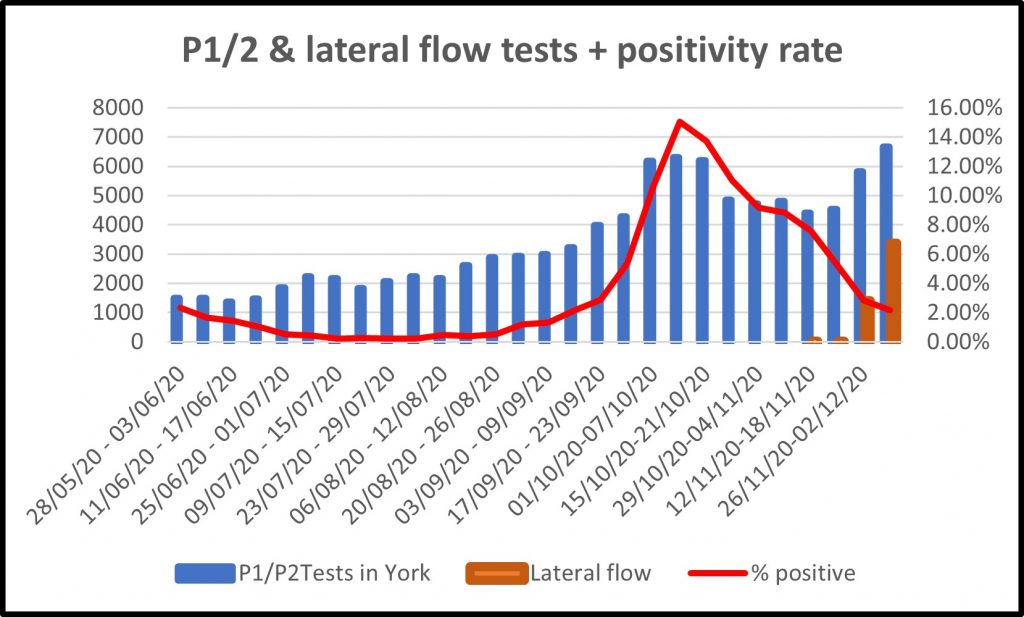
However these test were conducted before the recent surge in case numbers which became apparent from 10th December. Next weeks figures may therefore be viewed with some anxiety
NB. Local public health officials are blaming personal interactions, rather than communal activities like shopping, for the most recent increase in case numbers in the City