Deaths and test results
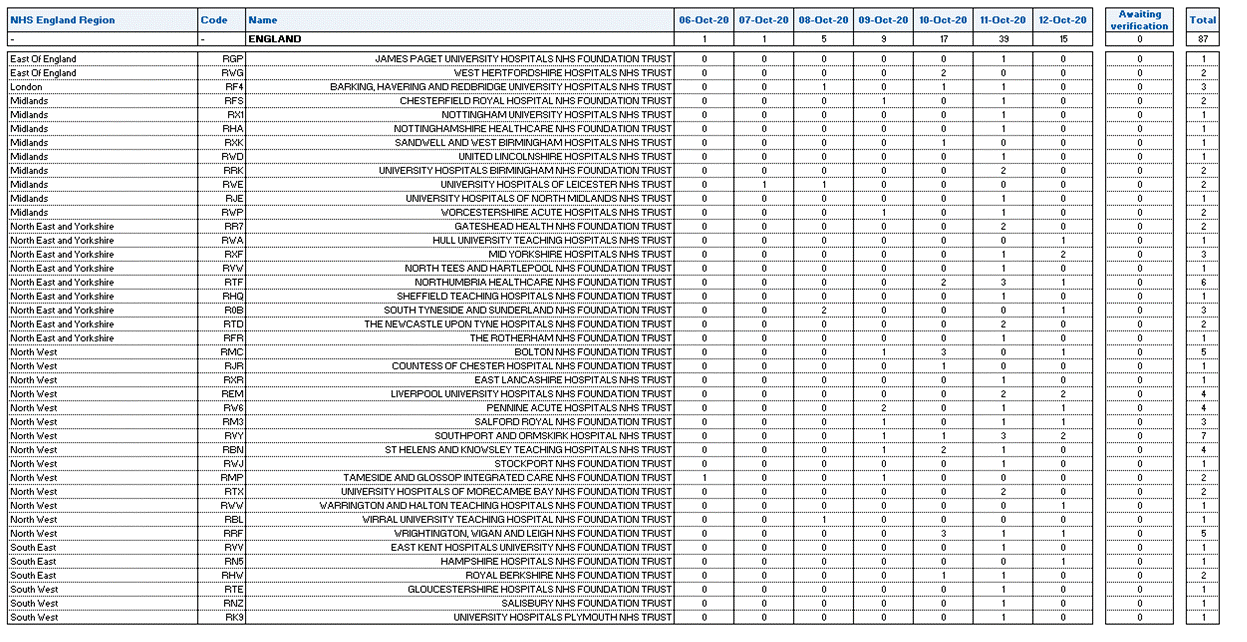
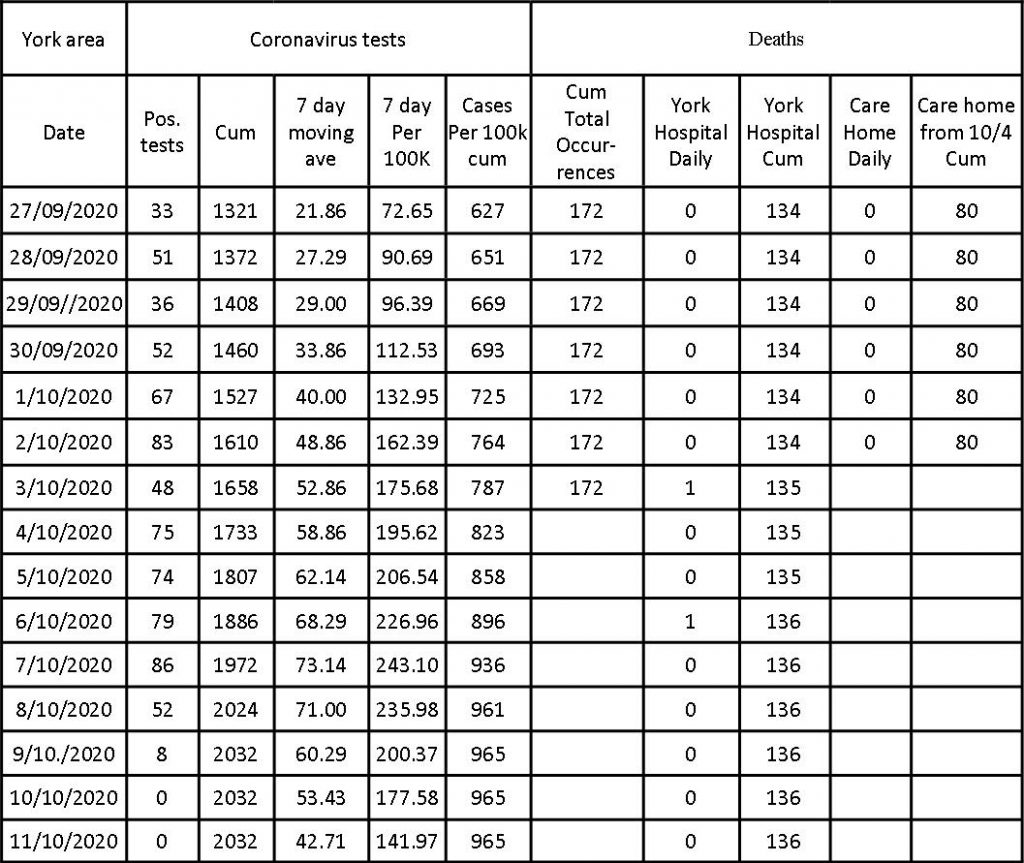
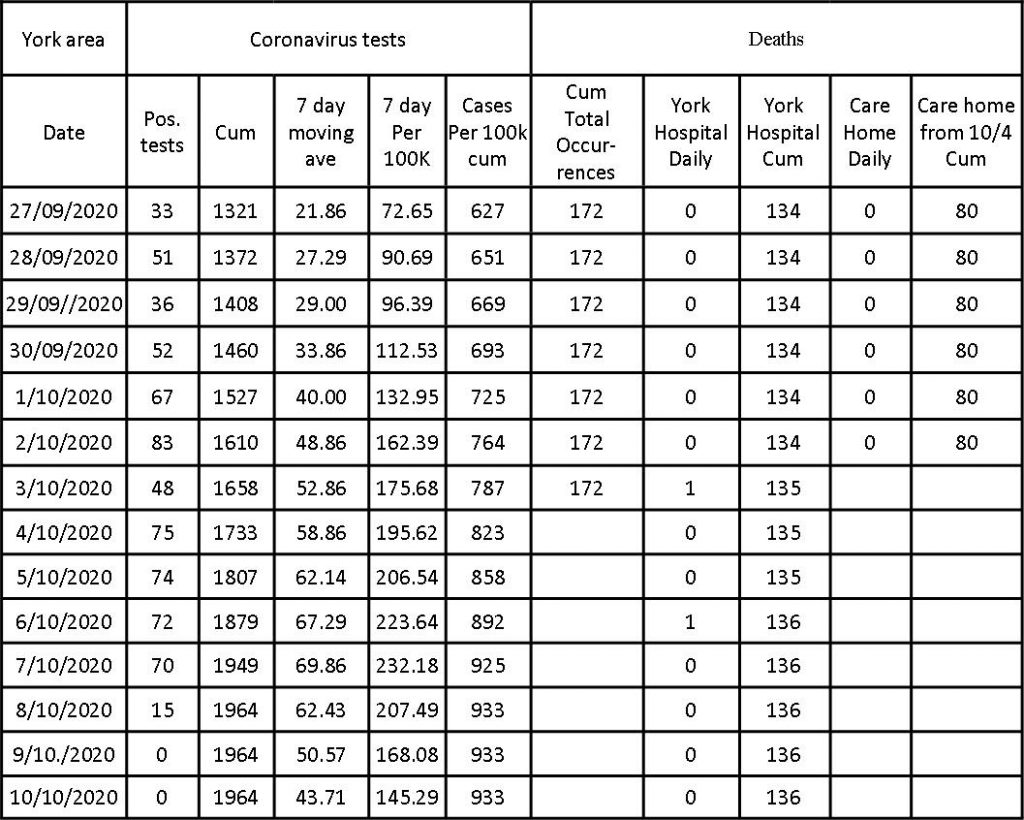
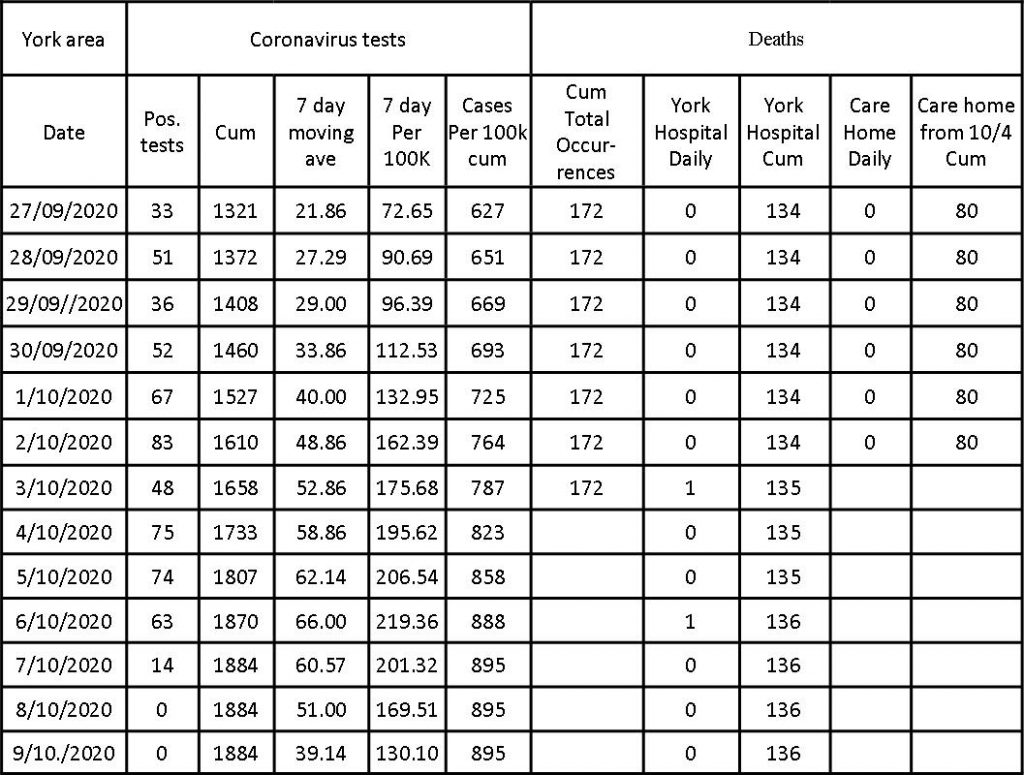
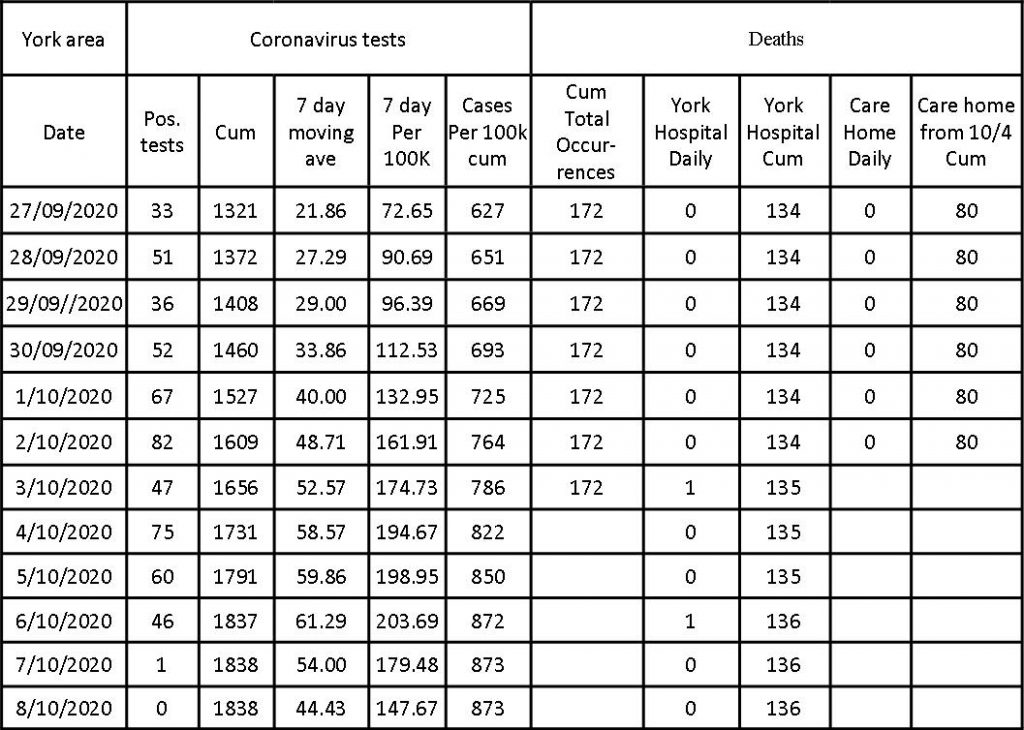
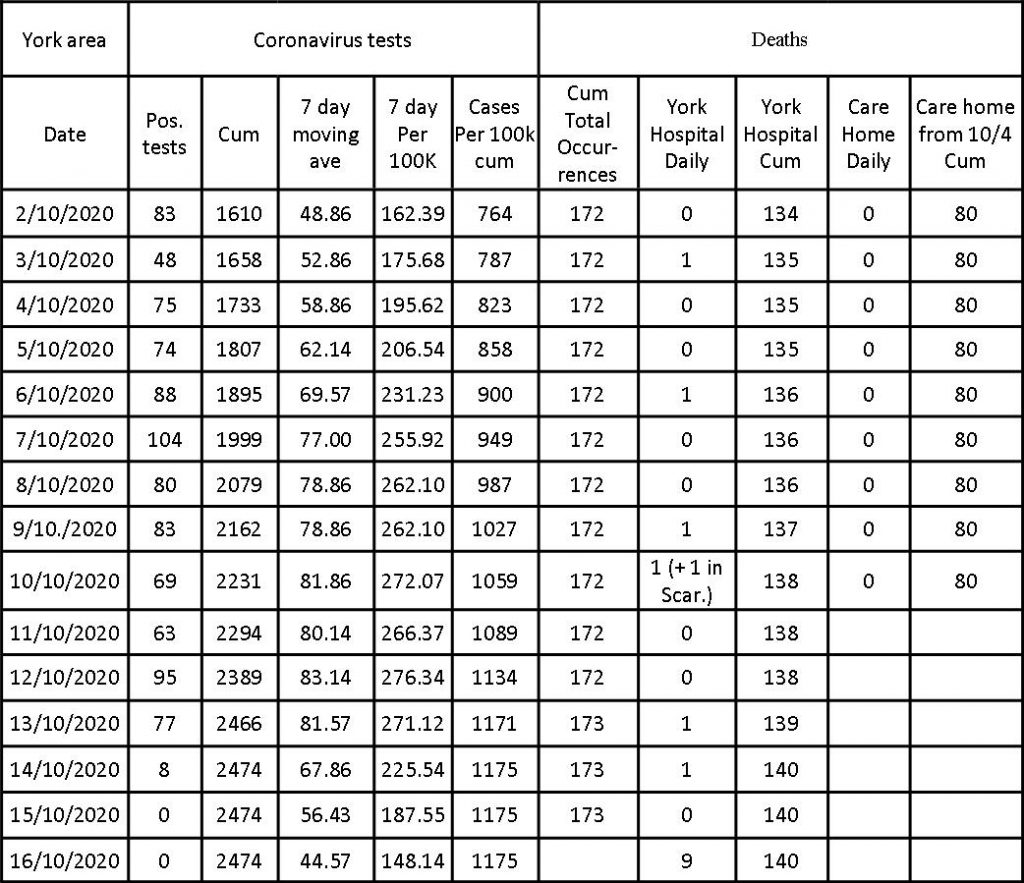
One additional death has been reported by the York Hospital Trust
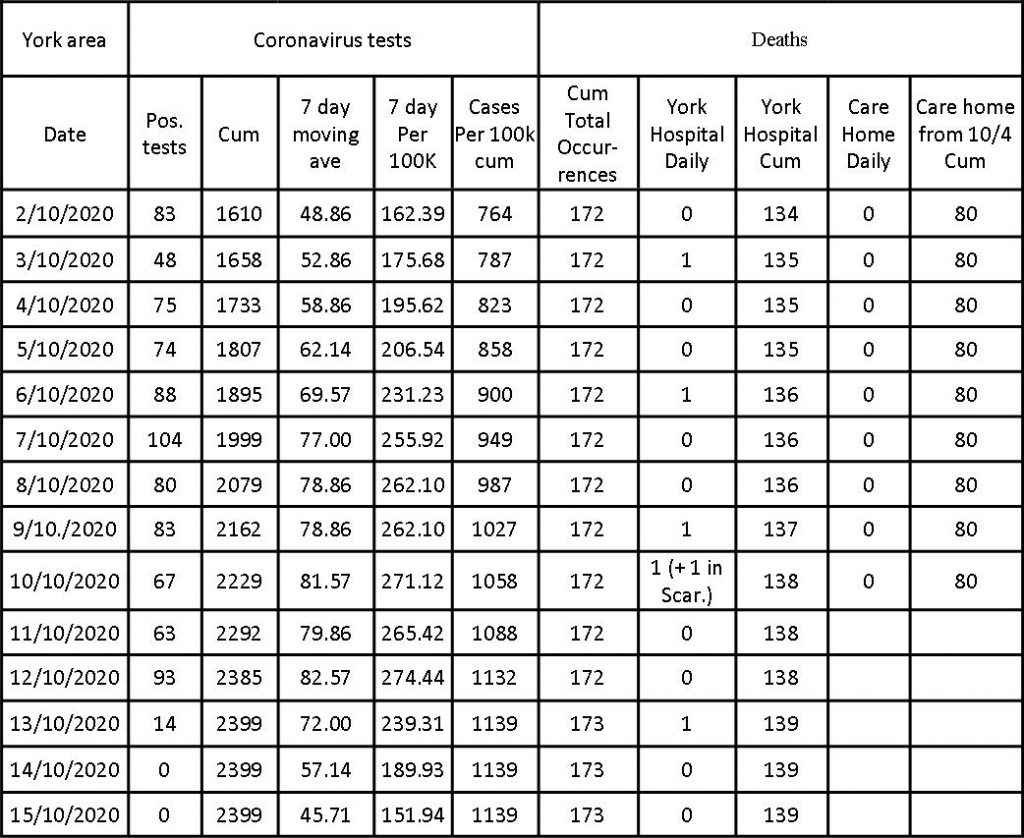
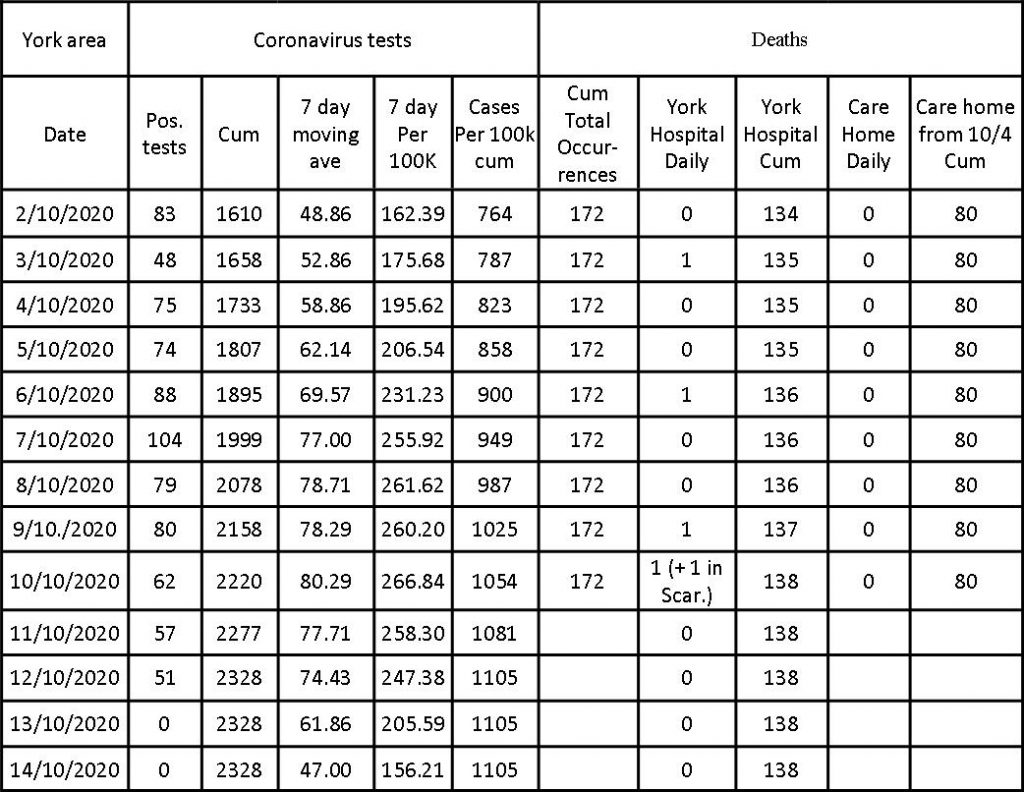
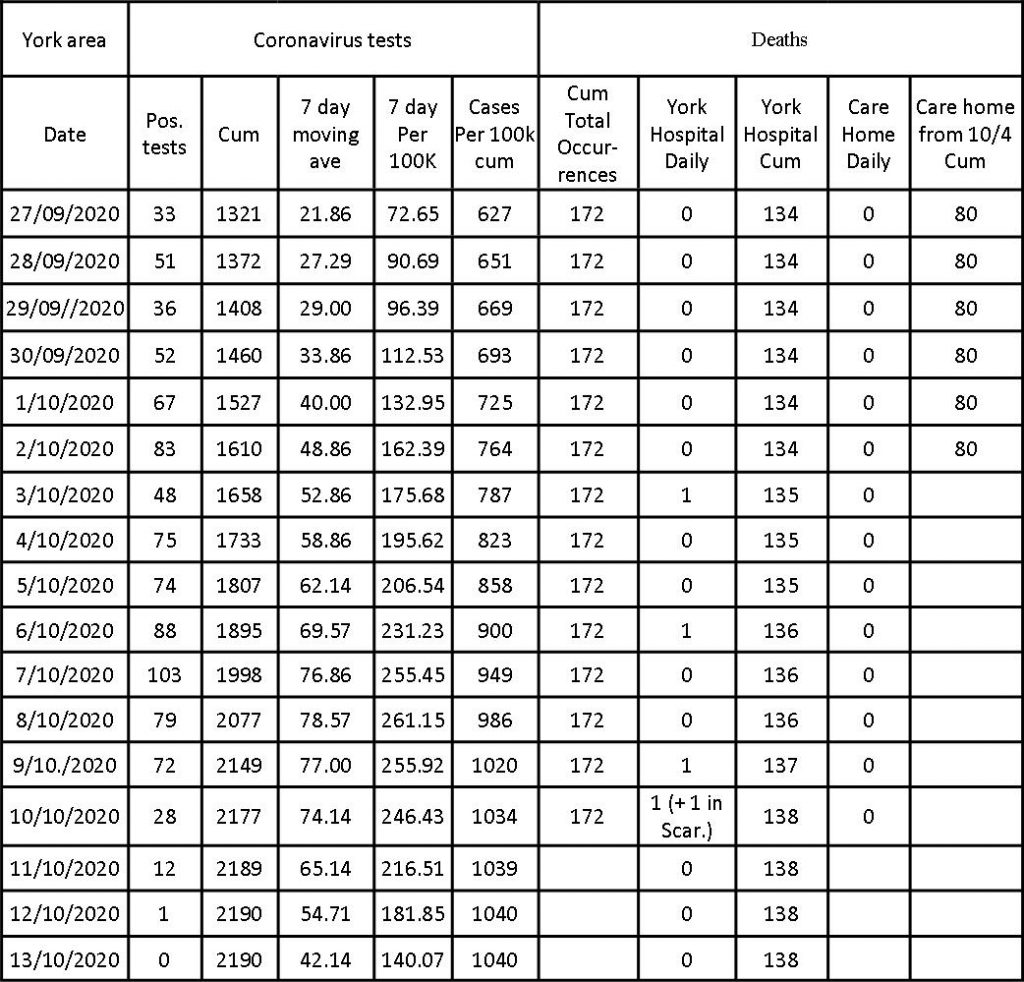
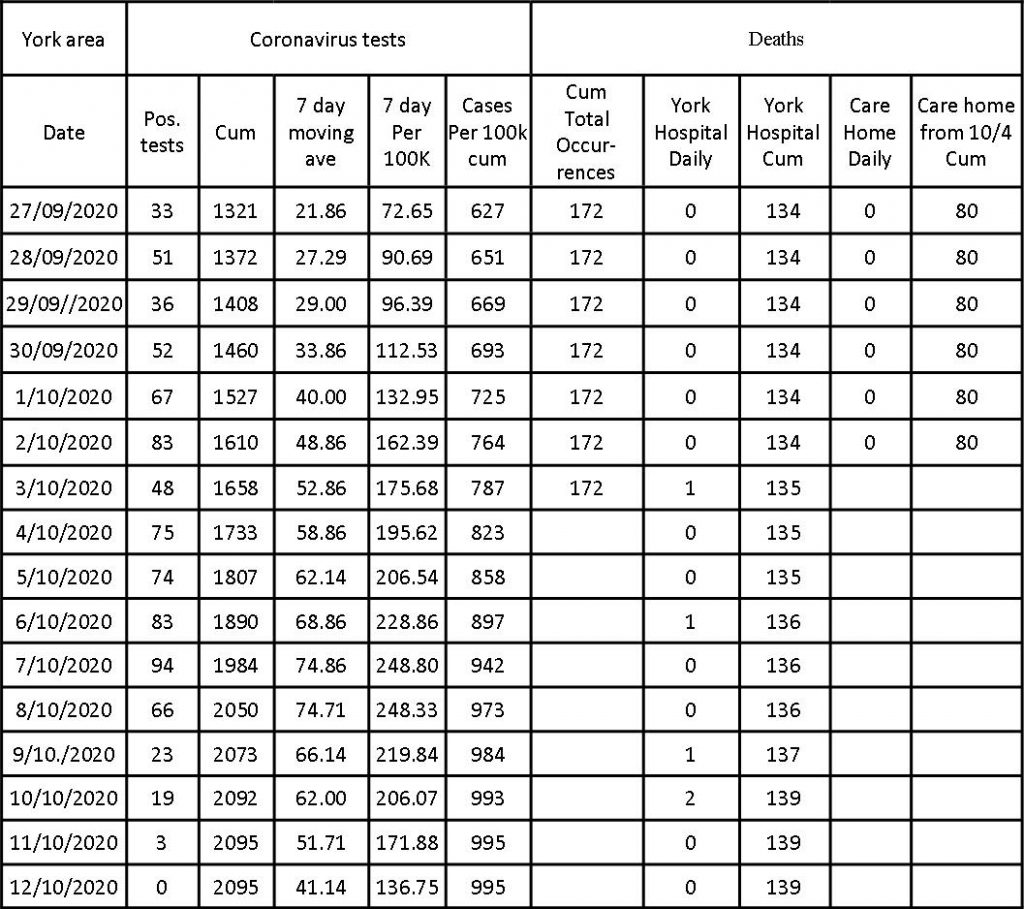
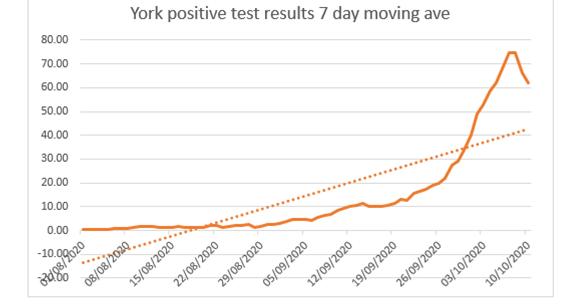
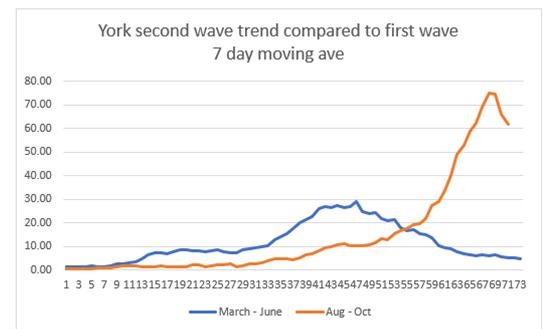
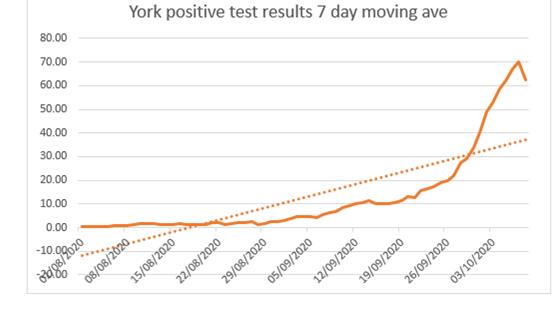
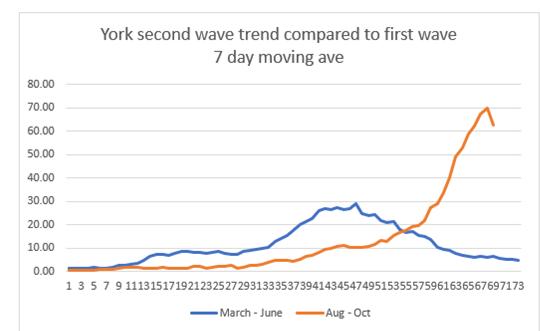
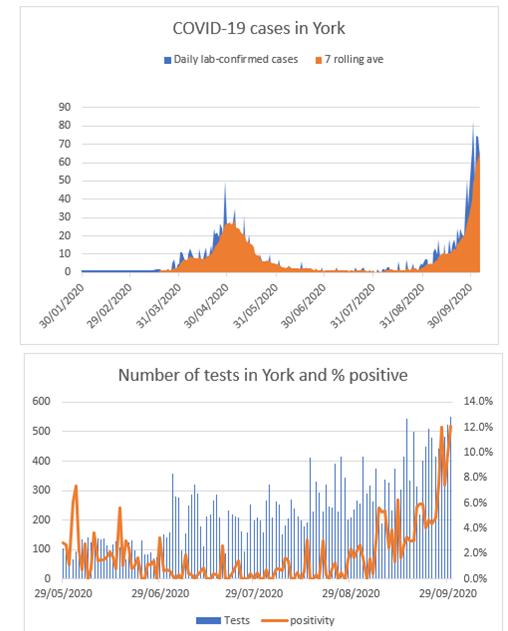
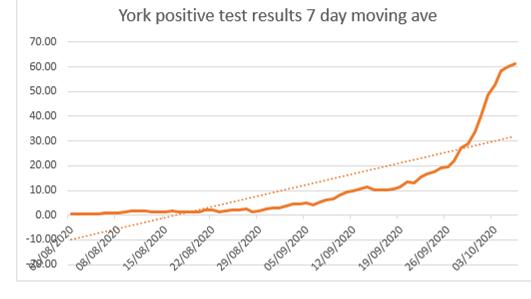
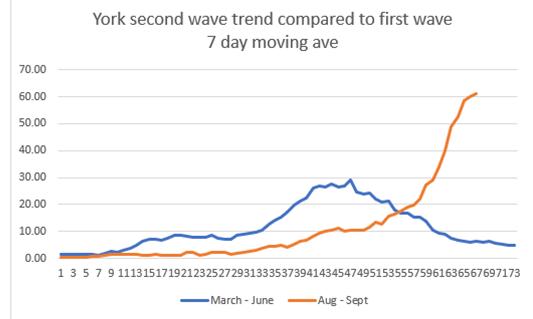
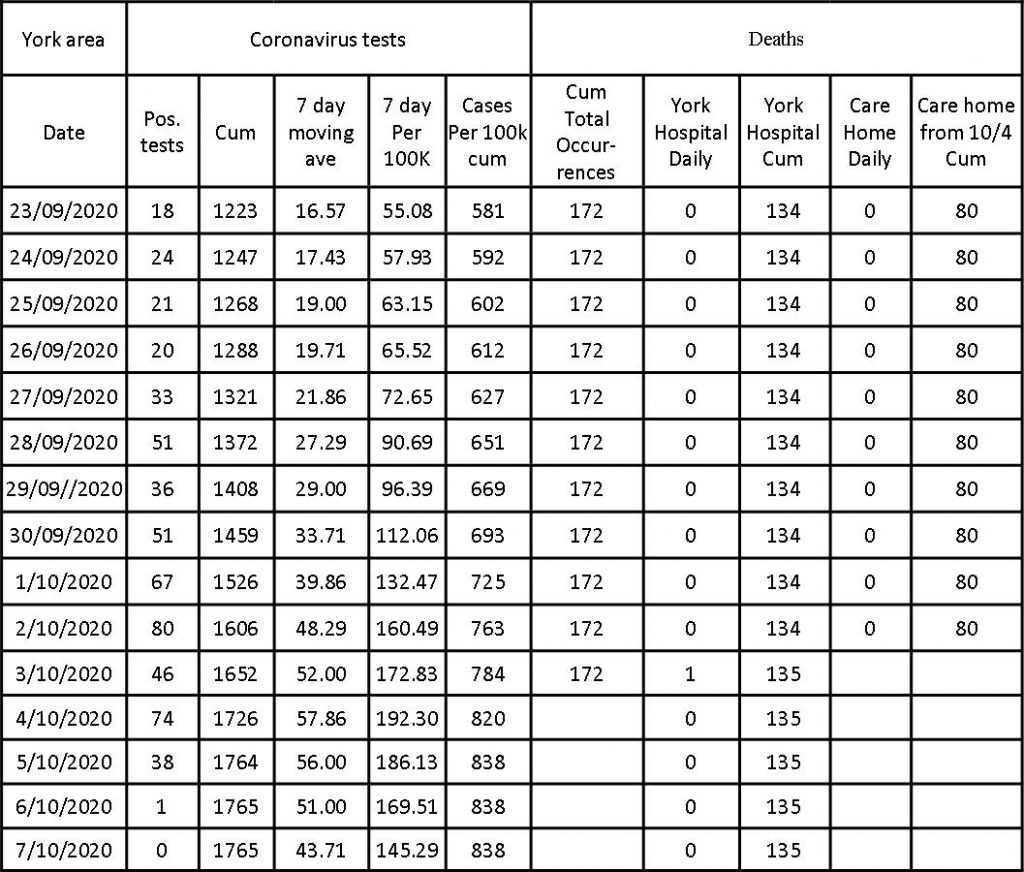
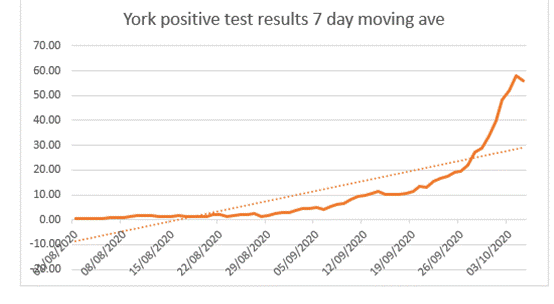
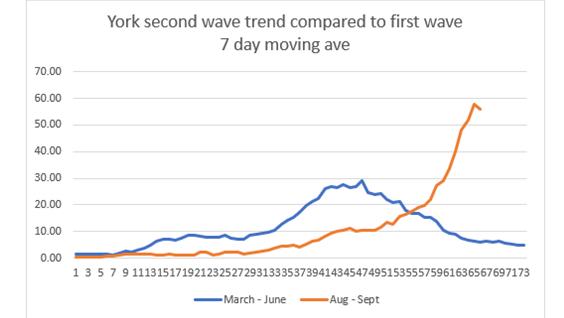
There have been 75 (SEVENTY FIVE) additional positive test results announced today bringing the cumulative total to 2474
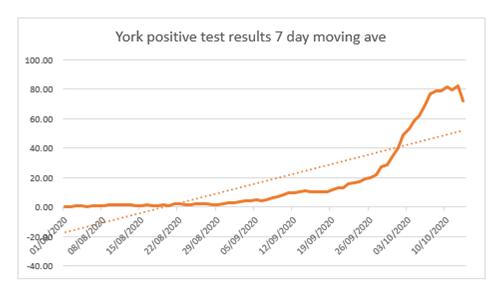
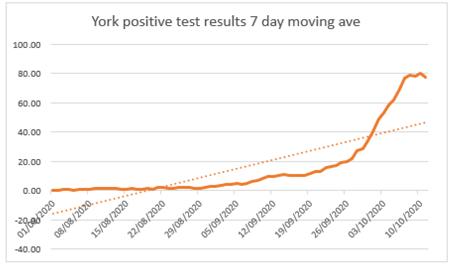
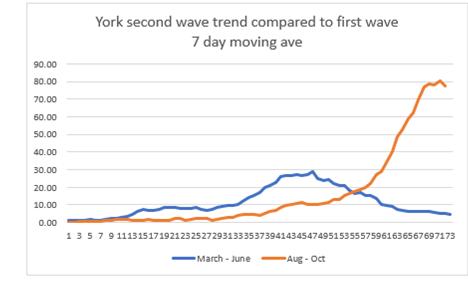
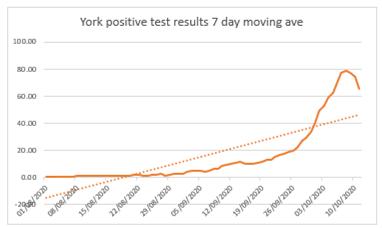
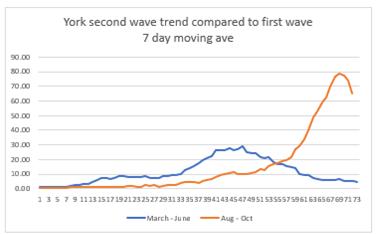
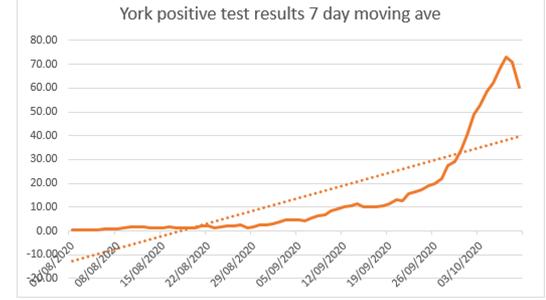
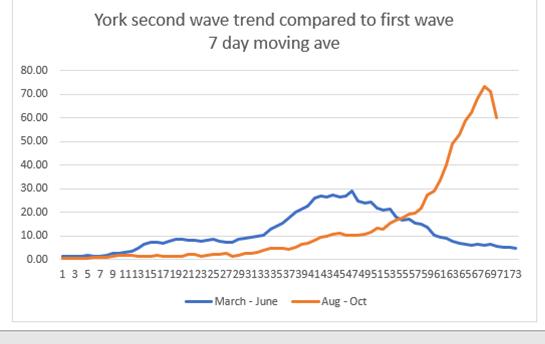
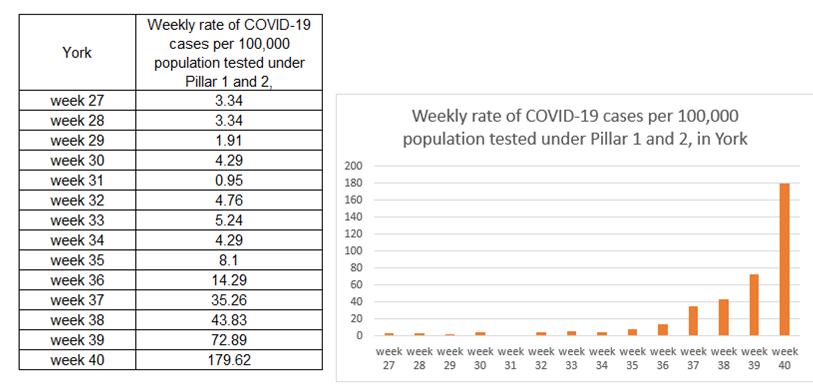
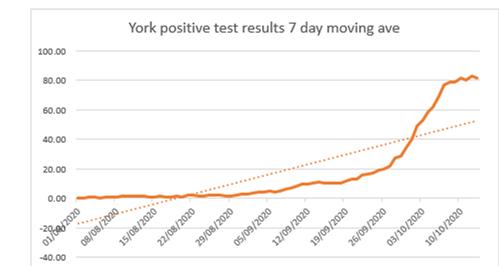
The rate per 100,000 population peaked at 276.34 on Monday
York will become a HIGH tier area with effect from midnight. This involves several additional restrictions including a controls on inter-family mingling.
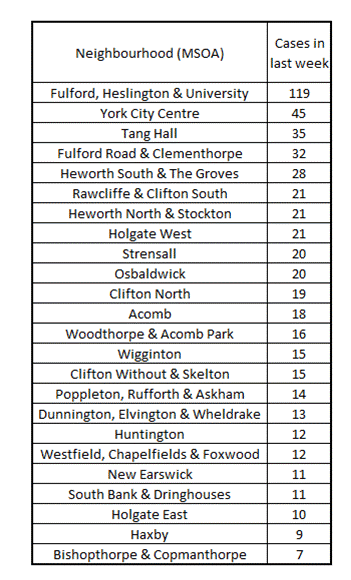
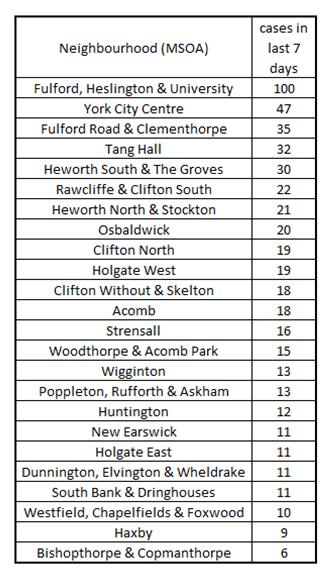
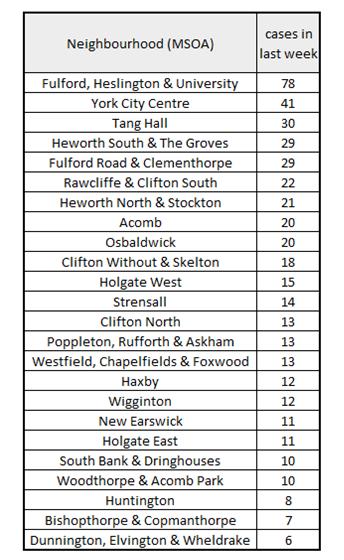
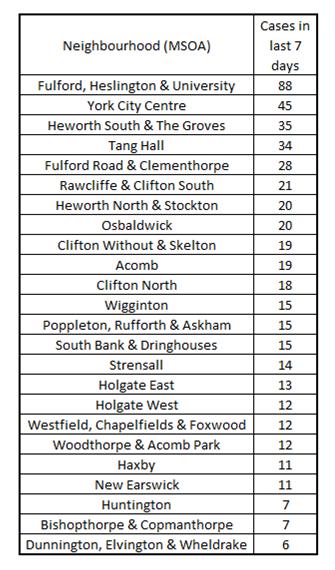
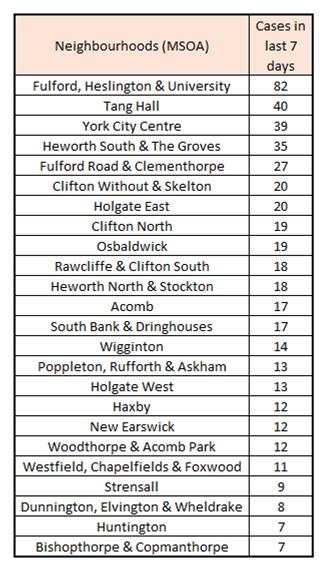
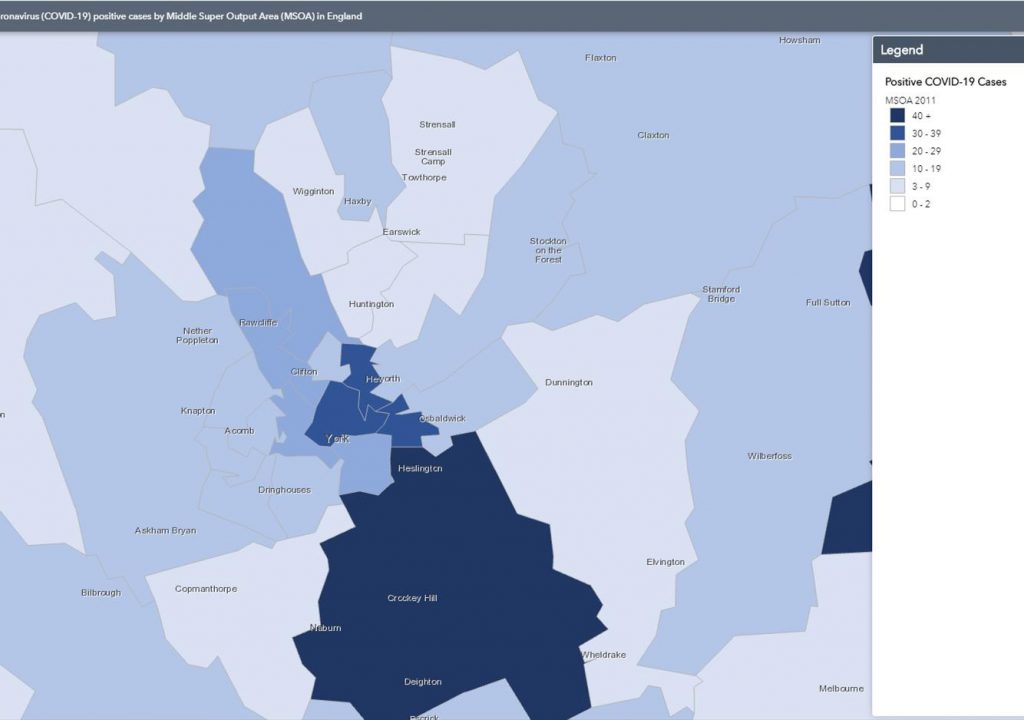
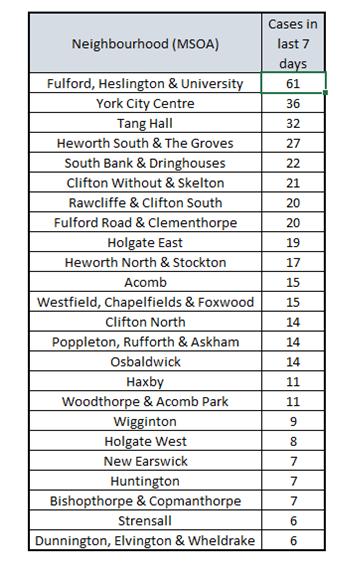
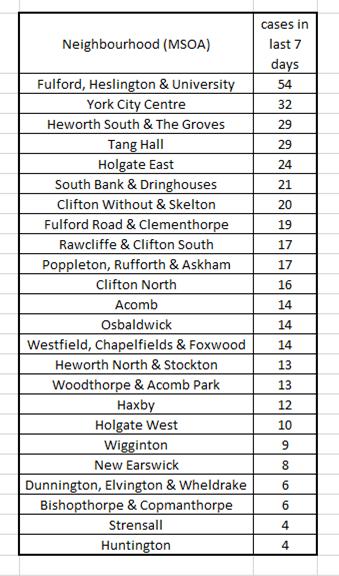
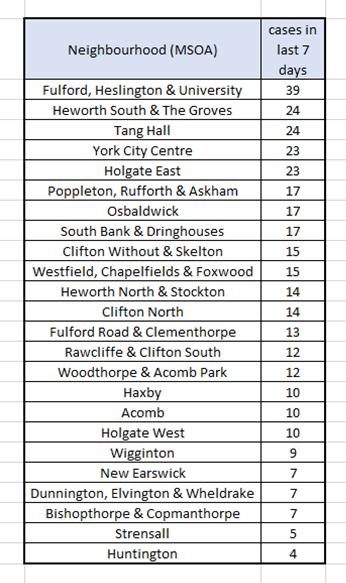
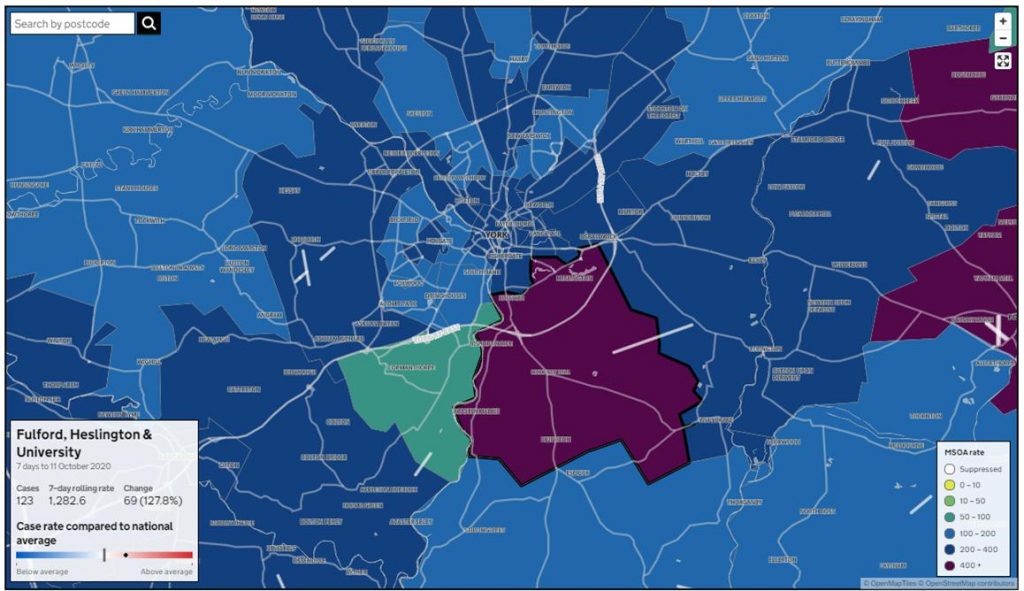
There have been some suggestions that the additional restrictions should only have been applied to neighbourhoods with high case numbers. However, as well as Heslington, this would have affected Tang Hall and the City centre which has the second highest number of cases. Many hospitality businesses are located in the City centre and so would have been caught by the tighter restrictions whichever option was adopted.
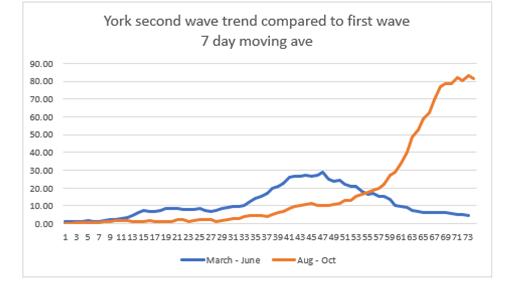
Council updates its narrative on Pandemic
The York Council has updated its commentary on the COVID crisis on open data. It is reproduced below
he data is accurate as at 8.00 a.m. on Friday 16.10.20. Some narrative for the data covering the latest period is provided here below:
People with Covid Symptoms
• NHS Pathways/111 triages – as at 12.10.20 there had been 400 total covid triages in the CYC area in the last 7 days. The peak number of triages was 653 in the 7 day period to 20.9.20.
• As at 15.10.20, the Covid Symptom App estimates 856.3 per 100,000 in York with symptomatic covid (responses from a sample of 5,258 people). The peak estimated rate was 1,029.4 on 29.9.20.
Diagnosed cases (Pillar 1&2 combined)
• As at 15.10.20 York has had 2,399 cases, a rate of 1139 per 100,000 of population. The rate in York is above the national average (1,017.4) but below the regional average (1,463.5) average.
• The PHE ‘Exceedance’ rating compares the no. of new cases over a 14 day period with the previous 6 weeks and provides a RAG rating to indicate if the previously observed trend in the no. of new cases is worsening. The latest rating for York (12.10.20) is Red.
• The provisional rate of new Covid cases per 100,000 of population for the period 7.10.20 to 13.10.20 in York is 239.3. (Using data published on Gov.uk on 15.10.20).
• The latest local “validated” 7 day rate for York for the period 3.10.20 to 9.10.20 was 260.2. The national and regional averages at this date were 159.6 and 263.0 respectively ( PHE Centre Daily COVID-19 Report 15.10.20).
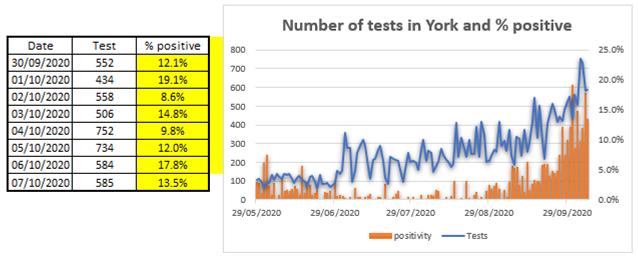
• As at 12.10.20, the latest 7 day positivity rate in York (Pillar 2 only) was 15.66% (867 positives out of 5,535 tests). The national and regional averages are 8% and 11.6 % respectively. The number of Pillar 2 tests being carried out in York is increasing.
• The Fulford, Heslington and University MSOA is in the highest 5% in the Yorkshire and Humber Region for new cases per 100,000 in the seven day period up to 9.10.20. Other MSOAs in the region (e.g. Leeds, Bradford, and Sheffield) which contain university premises within their boundaries are also on this list.
• As at 14.10.20 York University reported 288 individuals within the University community who were currently self-isolating because they have had a positive COVID-19 test.
• As at 13.10.20 York St. John reported 74 individuals within the University community who were currently self-isolating because they have had a positive COVID-19 test.
Contact Tracing
• Since 28.5.20 a total of 1,646 laboratory confirmed CYC Covid cases have been uploaded into the NHS Test and Trace system and 1,276 of the cases have been engaged. 5,000 ‘contacts’ have been identified and 3,506 of these have been traced.
Deaths
The two sources about deaths from Covid-19 at LA level are ONS data and local registrar data. They are derived from the same source (civil registration data). ONS data is more comprehensive as it includes deaths of York residents which have occurred and been registered outside York. Local registrar data is useful as it provides a breakdown by age and gender. The most recently available data is summarised below:
• ONS weekly data: For deaths occurring up to 2nd October 2020 and registered up to 10th October 2020, 172 deaths were recorded as having occurred for CYC residents (83 in hospital, 77 in care homes, 9 at home and 3 in a hospice. The number of deaths per 100,000 of population in York is 81.66 which is lower than the national average of 89.62. The most recent death reported for a York resident was in week 38 (12 to 18 September).
• ‘Excess’ deaths (ONS). In week 40 (26 Sept to 2 Oct), 30 deaths occurred for York residents, which is 1 fewer than the average weekly number for 2014-18. Over the last 19 weeks the total number of deaths in York has been 51 fewer than the average for the equivalent weeks in 2014-18.
• Local Registrar data: In the weekly data received on 12.10.20 (for deaths occurring up to 7.10.20), a cumulative total of 164 deaths of CYC residents where COVID-19 was mentioned (confirmed or suspected) on the death certificate, have been registered. The average age of the people who died was 82.6, with an age range of 53-104. The age profile of those dying in York is slightly older than the national average. 87 of the 164 were male (53%), slightly less than the national average (55.1%). 81 of the deaths occurred in hospital and 83 were community deaths (e.g. at home or in a care home or hospice). 72 people (43.9%) died in nursing /care homes (the national average is 29.3%). In addition 13 people (7.9%) who normally resided in nursing/care homes in the CYC area, died in hospital. The most recent death for CYC resident occurred on 7.10.20.
Data on deaths occurring in hospital are shown below. Deaths are initially reported for York NHS Foundation Trust which includes Scarborough Hospital and the further breakdown by site can be delayed. From local registrar data, 57.7% of COVID-19 deaths occurring at York Hospital have been CYC residents. (NB NHS Trusts record deaths following a positive covid-19 test (within 28 days) whereas ONS record deaths where covid-19 in mentioned on the death certificate so the totals are not the same).
• Deaths at York Hospital: As at 15.10.20, 139 deaths (awaiting confirmation of breakdown by hospital site) where the person had tested positive for COVID-19 and were being cared for at York Hospital have been reported. 220 deaths have been reported by the wider York NHS Trust.
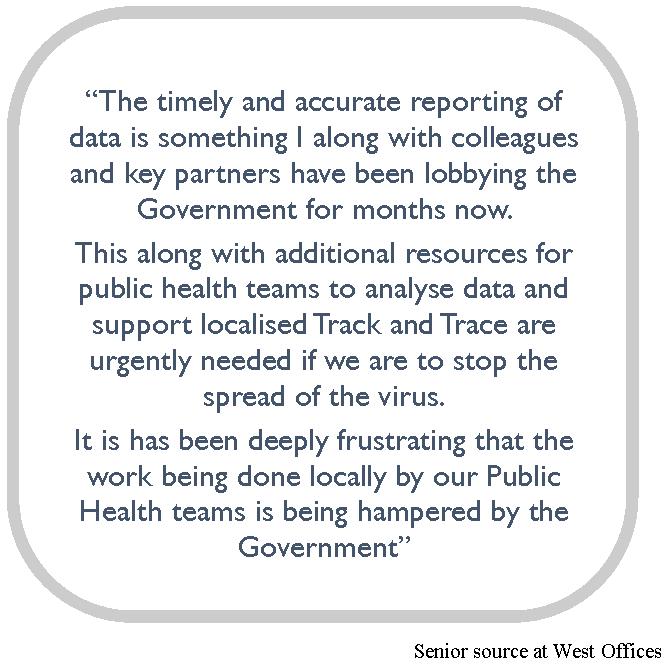
Deep frustration over COVID fact void
Local Conservative MP Julian Study has joined the increasing clamour for the authorities to improve the breadth and timeliness of the COVID stats being made available to York residents.
He rightly pointed out in the House of Commons yesterday that many of the figures, which drove the City into a “High” level of restrictions, have not been published.
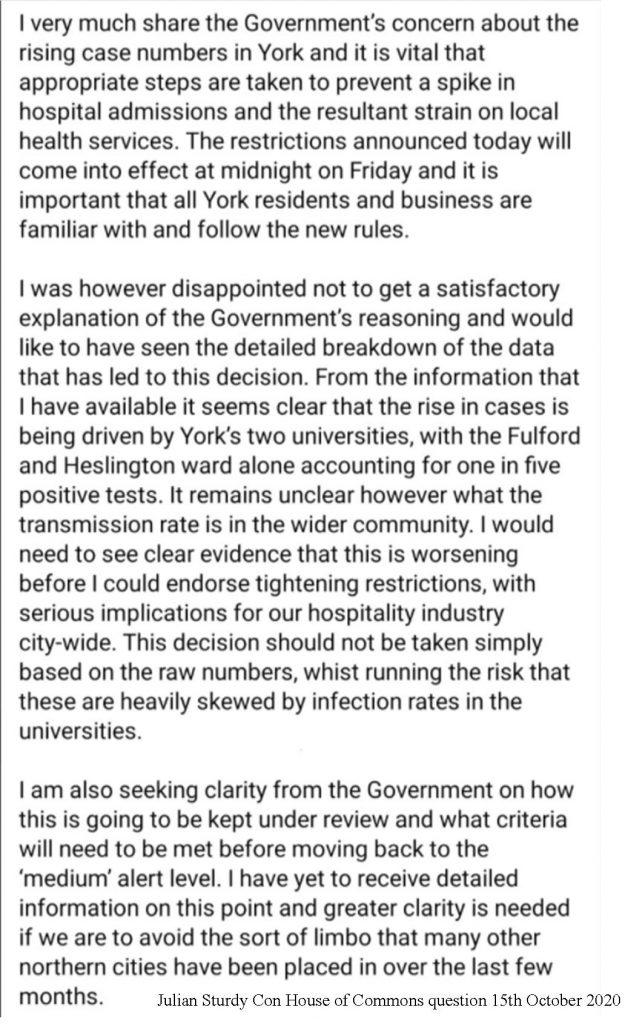
The concern reflects the views of many residents as well as the York Council.
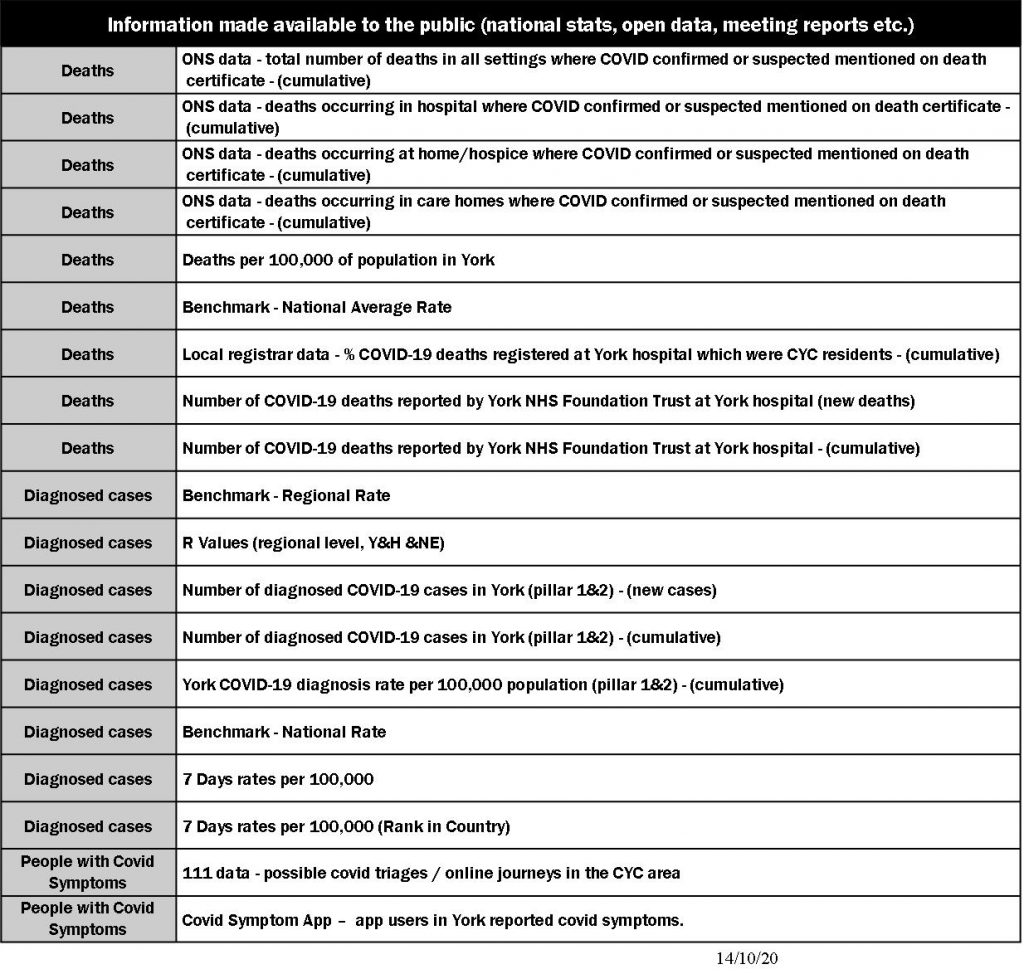
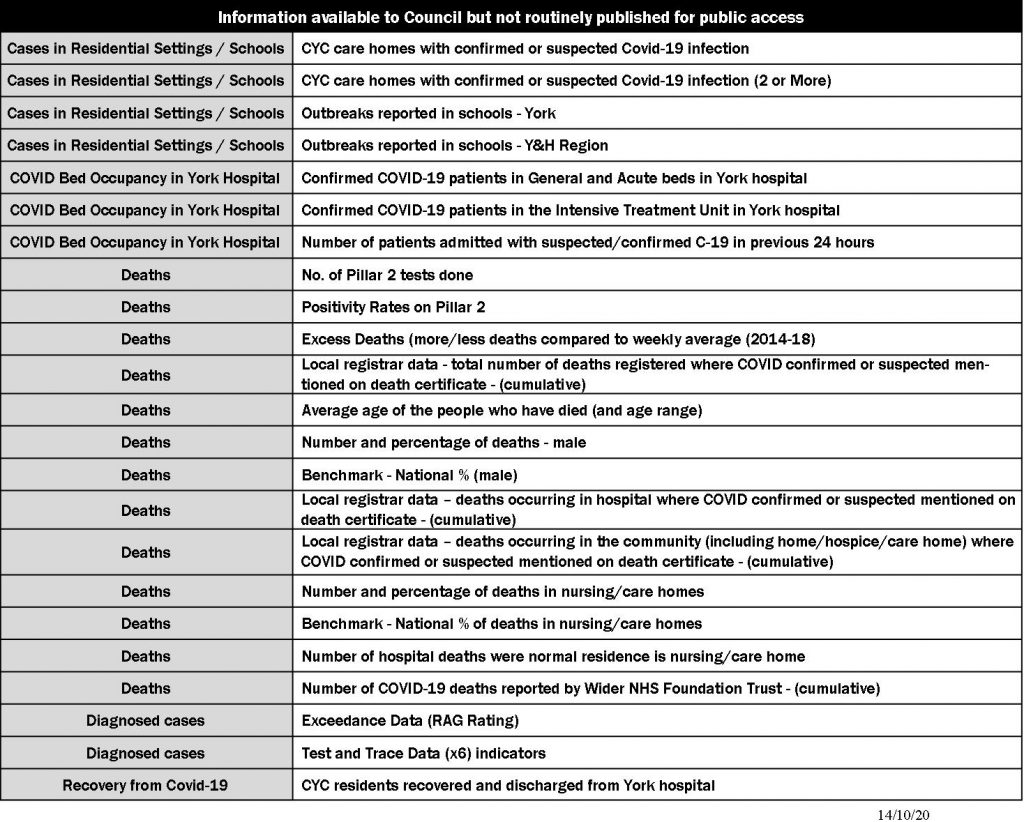
The Council has now made a list available of the information that it publishes on a regular basis.
It was responding to a suggestion that some additional numbers should be publicly available.
We identified key information which was needed to monitor progress daily.
There are several gaps including the percentage of tests undertaken which are positive (the information is available only for Pillar Two tests and is published by the government 2 weeks in arrears).
Other gaps include
| 1. The demographics of current cases in City (e.g. by age group, by ward) |
| 2. Test and trace results including the number of tests completed by channel (Pillar 1, Poppleton, Heslington, postal etc.), positivity, contracts traced, contacts still to be traced, linkages to workplaces, schools, universities etc |
| 3. Hospital admissions, bed occupancy, ICU occupancy and discharges |
The Council says that it doesn’t get this information from government so can’t publish it.
It also admits that there is a lot of information that it does get but currently chooses not to add to the “open data” web site (see table).
Not surprisingly there are now calls for more transparency.
In 2020 the authorities should be able to provide “real time” updates.
Against the background of a rapidly changing situation, the publication of information “two weeks in arrears” is simply unacceptable.
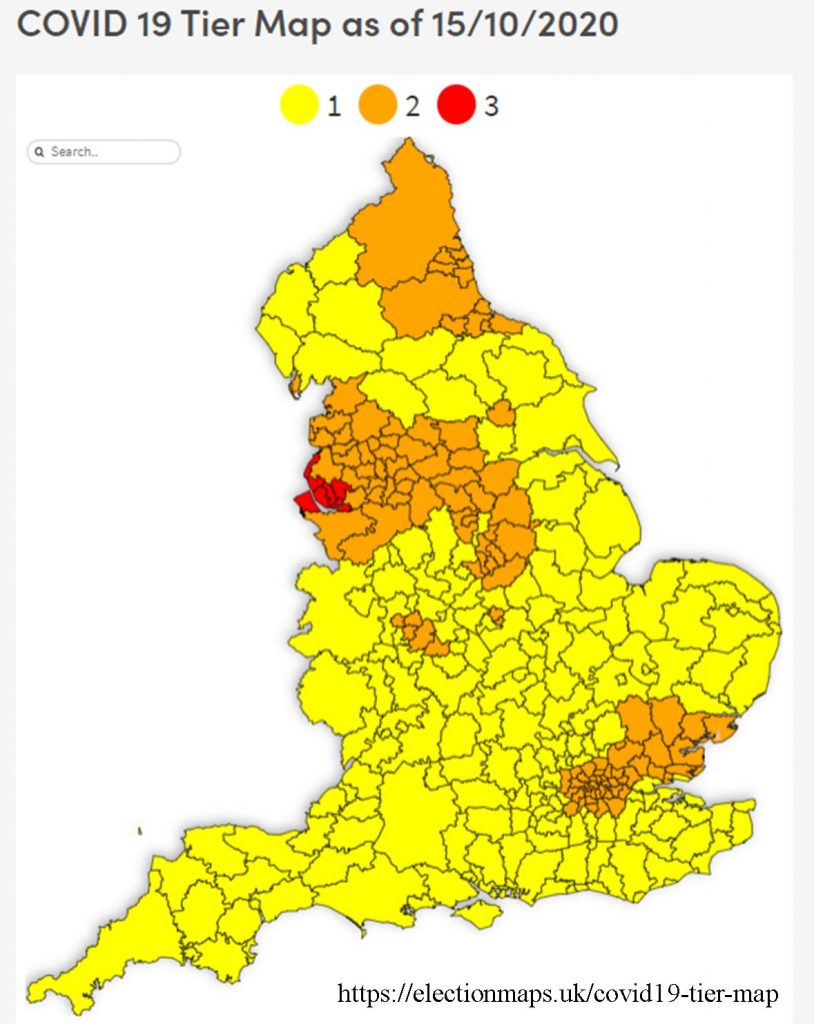
Alert level tier national map
Useful map of COVID restrictions in a rapidly changing world
