York Council aims to boost small business economy

With hardly a day going by without another retailer or café announcing the closure of premises in York City centre, the council will review its regeneration plans next week.

Last year £300,000 was allocated to promote what was styled as an “Inclusive Growth Initiatives Fund”. It was aimed at making sure that everyone could benefit from a strong local economy.

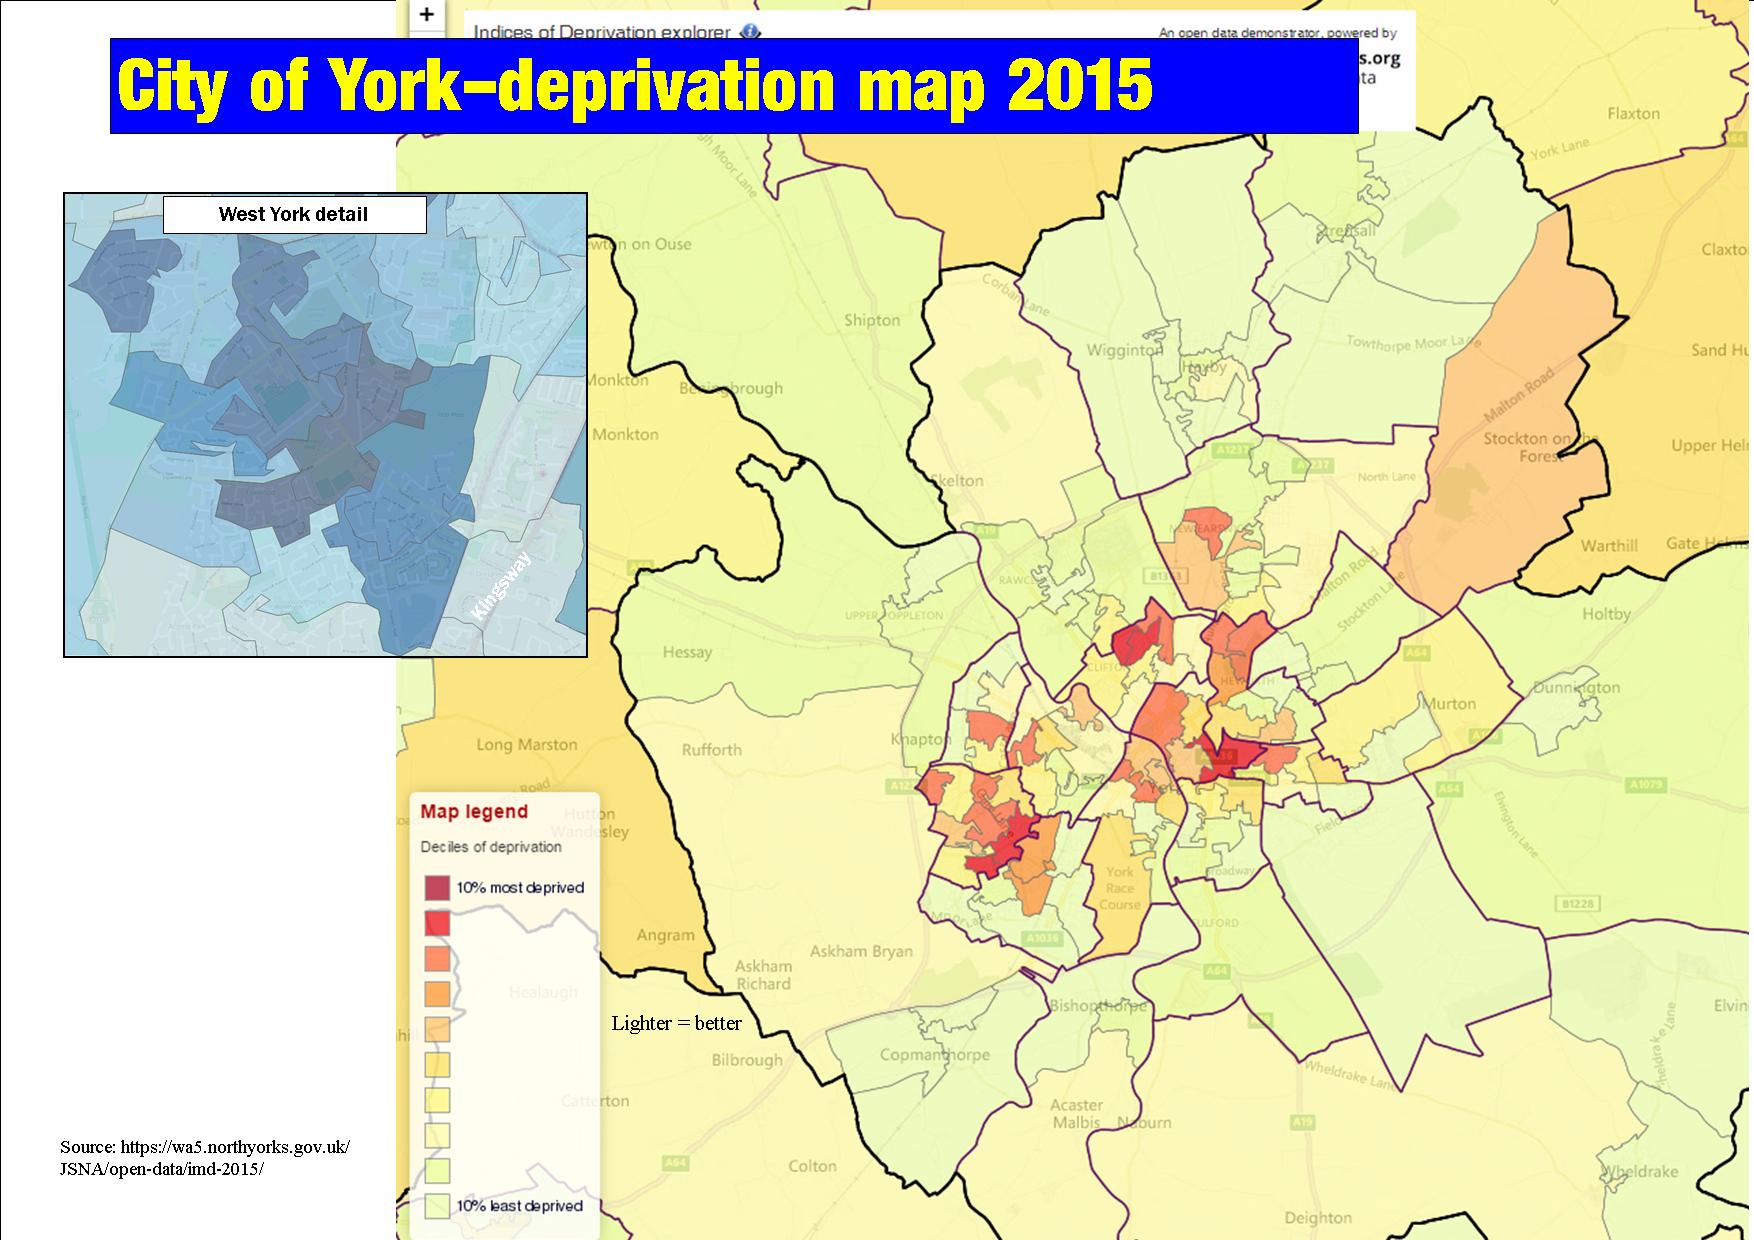
An update  report published yesterday says that the York economy is performing strongly. There are now more people in work than ever before, and average wages are higher than the rest of the region. 14,000 work in high skilled jobs.

Details can be found by clicking here

Eight initiatives were identified for investment and financial allocations are now being proposed

  • Establishing a York Poverty Commission: (similar to one operating in Leeds). £20k
  • Community hubs as drivers of economic growth (There are a hubs operating in Foxwood and Chapelfields): £40k
  • Greening our retail estate: £70k
  • Community jobs fairs: £30k
  • 14+ vocational training and work: £50k
  • Independent retail growth fund (using the success of the Bishy Road Traders campaign as a model): £40k
  • Mental health, wellbeing and employment: £25k
  • York Economic Strategy consultation: £25k

The Council report concludes, “Inclusive growth cannot have neighbourhoods that are left behind, opportunities that are only selectively available, or a two-tier economy where some people are doing well at the expense of others who are not”.

That may be good news for the poorer parts of York who feel that the quality of public services available locally has deteriorated in recent years.  

This is not least a result of the York Council being stubbornly insensitive to the effect that  closing leisure and sports facilities is having on vulnerable communities.

Latest poverty figures hide York shame

There has been some smug comments from  some politicians fallowing the release of the latest government figures on poverty levels. Known as the index of multiple deprivation, the figures give a clue to which are the most well off neighbourhoods and which the worst.

Government poverty figures

Overall York has fared well over the last couple of years. The York Outer constituency is now ranked 530 out of 533; the same as it was 4 years ago.

York Central has improved its relative position from 339 to 364. (High number is good). This largely reflects the “gentrification” of parts of the City and relatively high employment rates..

However, the overall figures disguise the level of poverty that is concentrated in some parts of the City.

The worst ranked neighbourhood (LSOA E01013443) is the Kingsway West area which includes Windsor Garth.

Kingsway neighbourhood. Officially the most deprived in York

It is the only York neighbourhood to rank in the bottom 20% in the country.

It fares particularly badly on health, employment and income indicators.

This neighbourhood is in the Westfield ward which itself is rated as the most deprived in the City.

The revelation should come as no surprise to the York Council. Campaigners have been pointing out for the last three or four years that the area was not only being neglected but that key services were being run down.

Kingsway ranks poorly on 8 individual indices and is the worst overall. Scores are out of 10 with low being poor.

The local multi user games area (MUGA) was recently closed down and a promised replacement has not materialised. Nearby the Lowfield’s playing field is also being built on while a bowling green has also been lost. The residents association folded a few years ago following complaints that its views were ignored by Councillors.

The neighbourhood does have a disproportionately high number of older people. This can drive down average income levels. It is also true to say that residents are mostly philosophical about their neighbourhood which still retains a good sense of community pride

However, it high time that the authorities – both local and national – made an commitment to regenerate public services for Kingsway residents.

How is your neighbourhood?

Council releases updated “ward profile” information

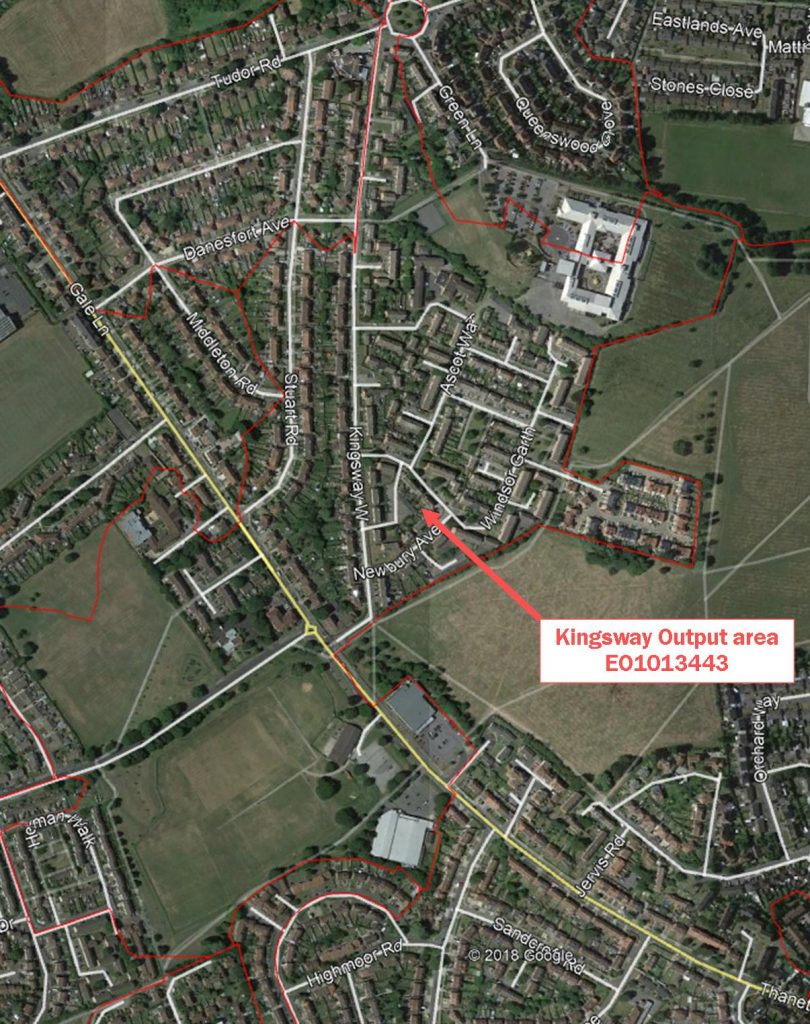
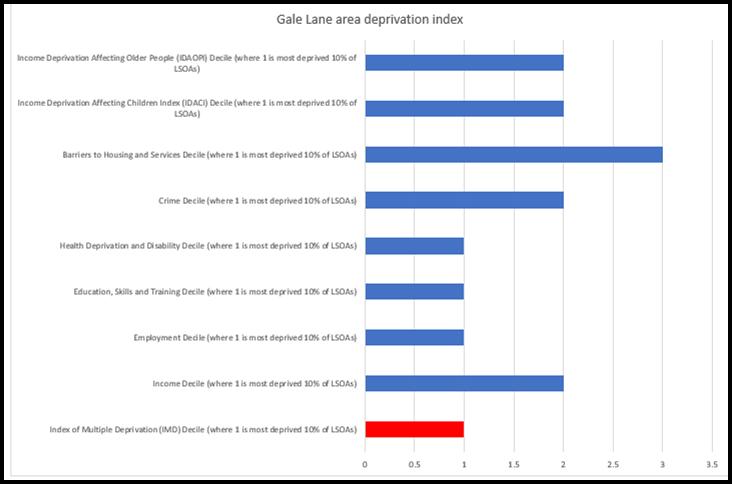
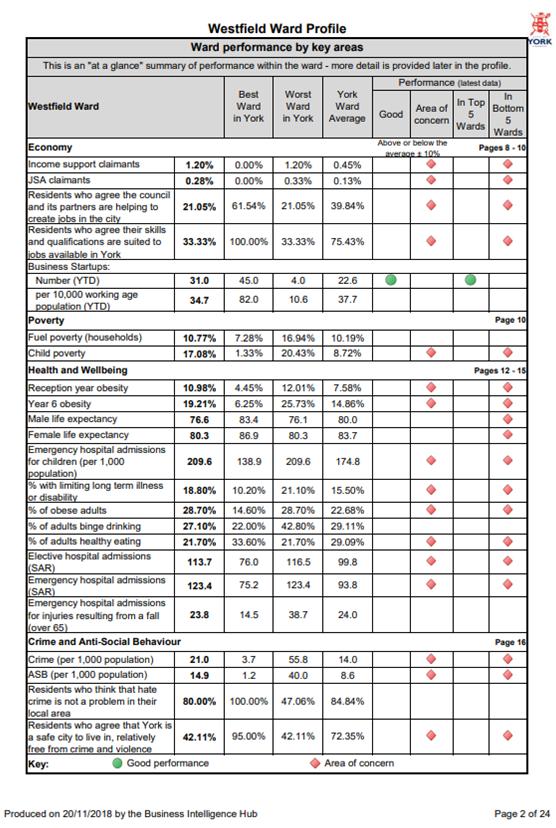
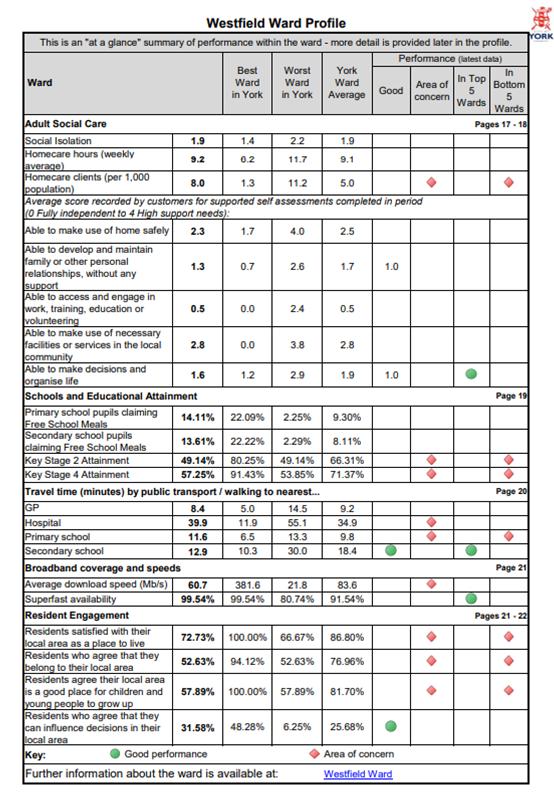
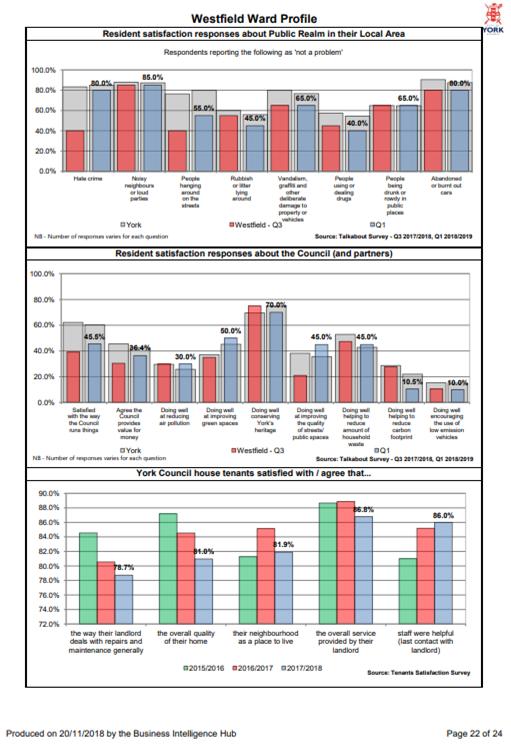
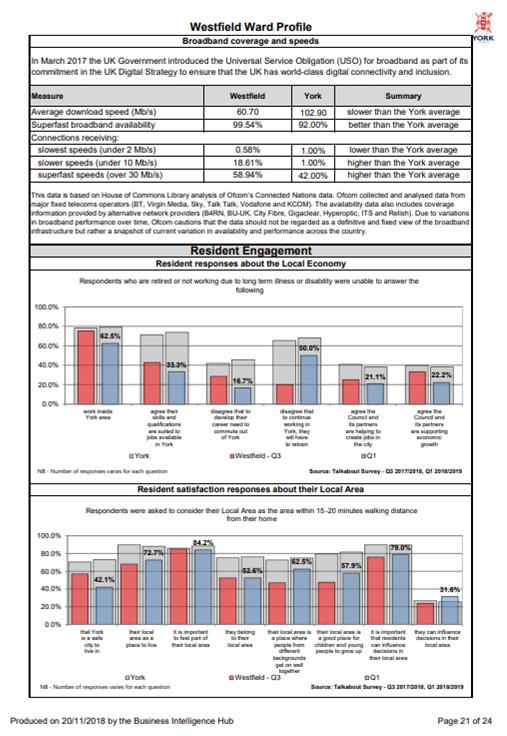
The York Council has updated the “Ward Profile” pages on its open data web site. Residents can view a range of statistics about the area in which they live. Click here https://data.yorkopendata.org/dataset/york-ward-profiles-2018-19-q2

A summary of the information is also provided at City level.

The figures compare local public service standards and residents’ views with the City averages (Westfield figures are shown in brackets in the summary below.

  • York has 208,163 residents (14,171) with 5.7% (3.1%) from a black and minority ethnic community group. 83.9% (78.9%) are in good health, with 15.3% (18.8%) stating that they have some limitation in day to day activities.
  • £637.58 (£594.62) was the Average Weekly Household Income in 2015/2016 (£629.00 [£580.00] in 2013/2014).
  • 66% (57%) own their own home, either outright or with a mortgage, 18% (9%) are private renters and 14% (32%) are social tenants. There are 7,614 Council Houses in York.

Westfield continues to be the “poorest” ward in the City although average incomes are now steadily rising.  It is consistently in the “worst” 5 wards when judged on a range of indicators including the economy, poverty, health & Wellbeing, crime, schools, transport and residents engagement.

However more people living in the ward agree that they can influence decisions in their local area than the city average.

The area also scores well on the availability of “superfast broadband”, travel times to secondary schools and business starts ups while most social care stats are positive.

The numbers unemployed have also fallen dramatically over the last 2 years.

Perhaps the biggest underlying problem is health, with 35% of children judged to be overweight. The area also has the largest proportion of overweight adults. Life expectancy is below average for both male and females. These figures will add to criticism of the York Councils decision to reduce the amount of open and sports space available in the ward.

Satisfaction with the Council as land lord is declining according to tenants’ views. Lack of car parking dog fouling and drug use are cited as significant issues in some areas.

All in all, the figures make interesting reading although the major impression is that things have improved over the last year or two.

Heating bills halved by gas central heating project for vulnerable York households

 City of York Council is working with Better Homes Yorkshire to help to tackle fuel poverty by installing 19 gas central heating systems in the city thanks to the Government’s Central Heating Fund.

Central heating fund

The central heating fund was launched by the then coalition government in March 2015

One home has already halved its estimated heating costs from the project.

York and eight other Local Authorities, the West Yorkshire Combined Authority and the Leeds City Region Local Enterprise Partnership are taking a similar approach by identifying residents on a low income living in energy inefficient homes.

One of the 19 York households benefiting from this, is a 46-year-old disabled woman living alone in her own home. Her mobility is such that it makes the safe and regular use of her only form of heating, an open coal fire, impossible.

Her water was heated by an electric immersion boiler. A community occupational therapist referred the resident to Better Homes Yorkshire and to City of York Council’s scheme.
(more…)

Tax credit changes will hammer families in York say Lib Dems

Cllr Sue Hunter8,000 families in York will lose out under Conservative plans to cut tax credits.

Figures produced by the House of Commons Library show over three million low-income working families currently in receipt of tax credits will see their entitlement reduced, as part of the Government’s proposals.

Despite claims from the Conservatives that those affected will benefit from plans to increase the minimum wage, the independent Institute for Fiscal Studies has said Tory figures don’t stack up. IFS analysis shows a £750 average annual loss for families in York will only be offset by £200 as a result of the new minimum wage.

Liberal Democrats have opposed the move and said it undermines the work of the Coalition Government, to make sure it always pays more to be in work than on benefits.

Cllr Sue Hunter (pictured), Liberal Democrat Councillor for Westfield, said:

“The changes to tax credits will hammer families inYork. The move completely undermines any claim the Tories have of being on the side of working families.

“What makes this even worse is that 12,200 children in our area will now be forced to live in poorer households, reducing their life chances and making it harder for their parents to make ends meet.

“Study after study have shown that the Conservative’s claim to be supporting low income families through a minimum wage increase nowhere near make up for these cuts. It’s time for them to come clean and be honest with those doing the right thing and going out to work.

“I am pleased that Lib Dems are opposing this measure. We worked hard in the Coalition to ensure that work would always pay more than choosing to remain on benefits. It is a disgrace the Conservatives are now undermining this.”

The Lib Dems are currently opposing the plans in the House of Lords: http://www.libdems.org.uk/lib-dems-table-fatal-motion-tax-credits

York beating relative poverty? Latest figures are encouraging

Deprivation map 2015

The latest deprivation statistics which can be viewed on the North Yorkshire open data site reveal that no York neighbourhoods are now ranked among the 10% most deprived in the country.

The Kingsway West area – the subject of an innovative anti poverty initiative by the then LibDem led Council – is one of those that has now climbed up the league table.

Deprivation is measured on a number of indices where 10 is the best that can be achieved.  These are: Income  (Kingsway 2), Employment  (2), Barriers to housing and services (2), Crime (2), Education, skills and training (2), Health and disability (1), Living environment (6), Income affecting children (2), Income affecting older people (2).

Elsewhere in North Yorkshire there are nine deprived areas (in the bottom 10% in the country) in Scarborough, one in Harrogate and one in Selby

Middlesbrough, Knowsley, Kingston upon Hull, Liverpool and Manchester are the five local authority districts with the largest proportions of highly deprived neighbourhoods in England. More details can be found by clicking here

Executive: Impact of financial inclusion work in the city

An annual report outlining the impact of advice and support to residents on improving their financial situation will be discussed by City of York Council’s Executive on 30 July.

The report provides an update of the financial inclusion work carried out by the council during 2014/15. The Financial Inclusion Steering Group aims to help ensure that local people have knowledge of and access to appropriate financial services, allowing them to make more informed choices to achieve and maintain financial stability.  (more…)

York Children’s Health Profile Data Released

Public Health England has this week released Child Health Profiles for City of York Council, which provide a snapshot of child health in the city.

Child Labour

Fewer children living in poverty

The key findings from the report show that the health and wellbeing of children in York is generally better than the England average and that children and young people under the age of 20 make up 21.7% of the city’s population.

The profiles help City of York Council to work in partnership to improve health in the local area. The profiles contain data on a wide range of issues about and affecting child health, from levels of childhood obesity, MMR immunisation rates, teenage pregnancy and underage drinking, to hospital admissions and levels of child poverty. Each profile provides two types of information: background demographic information about the children in each area; and comparative analysis with other local authorities across the country.

The data shows that in 2013 there were 2045 live births in York, which saw the number of children in the city aged between 0 and 4 remain at 10,700 and the number of children aged 0 to 19 increase to 44,000.  The findings project the number of children in York aged 0 to 19 by 2020 will be 44,900.

According to the child population section the life expectancy at birth of boys and girls in York is 79.4 and 83.5 respectively.   The regional figures for Yorkshire and Humber are 78.5 and 82.2 and nationally 79.4 and 83.1 putting York above the regional and national average.

The level of child poverty in York is better than the England average with 11.7% of children aged under 16 living in poverty, a fall of 1.4% since the last Child Health Profiles data was released.
(more…)