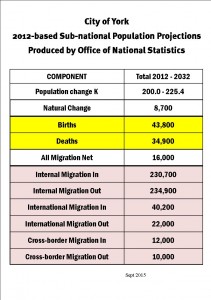
Anyone currently planning to vote on the EU referendum on the basis that they may get more influence over their local community should  think again. The report on the latest version of York’s Local Plan makes it clear that any population growth forecasts (including migration numbers) must be in line with government thinking. Councils cannot opt for lower figures – justified by more realistic economic development assumptions – without risking having a Whitehall written plan imposed on them.
The result is that the York Council has published a Local Plan which seeks to build an additional 842 homes in the City each year.
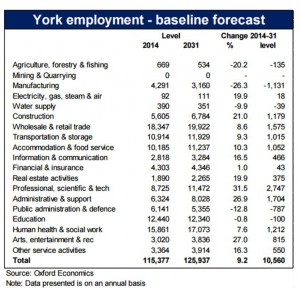
Most of these will go to the economic migrants who will be needed to fill the extra 15,000 new jobs (net 13,000) that the Council says will be created in the period up to 2032. Most of these new jobs will be in professional & scientific sector (+2945) although high growth is also forecast for
- retail (+2412),
- administration (+1933),
- tourism (+1847)
- Construction (1353) &
- Social care (+1212).
Declining industries are identified as
- Manufacturing (-1231)
- Public admin and defence (-587) &
- Finance & Insurance (– 448)
The Council concludes that it needs to provide an additional 16,820 homes in the period between 1st April 2012 and 31st March 2032 (842pa). That is similar in total to the figures included in the 2014 draft when 14,816 were to be built in the period up to 2030. It is higher than the figure suggested a year ago (750).
Significantly it is also more than double the 400 a year average actually built since 2011.
So what has changed?
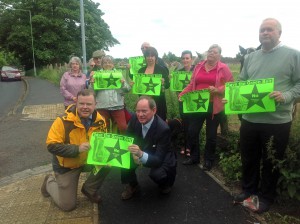
Then LibDem Euro MP Edward McMillan Scott with Westfield residents opposing the development of Acomb Moor in 2013. The site is scheduled to continue in the Green Belt under plans published this week
The latest proposals represent an improvement on all the draft plans published since February 2011. The 2011 Plan – originated by the then Liberal Democrat controlled Council – did not involve any building on the Green Belt. In total, space for 12,075 dwellings was identified at that time.
An updated critique of Labours “Big City” approach was published 3 years ago.
The new Plan substantially reduces (but does not eliminate) the need to build on land which has traditionally been regarded as Green Belt (and is currently protected as such). Over 407 hectares of green space will be lost under the new proposals. That compares to the Plan published in 2014 by Labour, which would have seen 911 hectares of Green Belt lost.
The new Plan (rightly) re-inserts an allowance for “windfall sites” with an assumption that around 150 of these small brownfield sites will become available each year. This is substantially less than have arisen over recent years and is therefore a very cautious estimate.
After taking into account existing outstanding planning permissions – and the number of homes built since the start of the plan period in 2012 – the Council believes it needed to identify sites for 8277 homes.
In addition, it plans to earmark land to build a further 2540 homes between 2032 and 2037.
We will look in more detail later at the effect that this policy has had on individual sites. However, there is some very mixed news with, on the one hand, sites like Acomb Moor freed from the menace of development, while a new threat has emerged which could lead to building on the football pitches and amenity land at Lowfields school.

Football gala at Lowfields playing fields. The latest Plan threatens to build on the football pitches in the area.
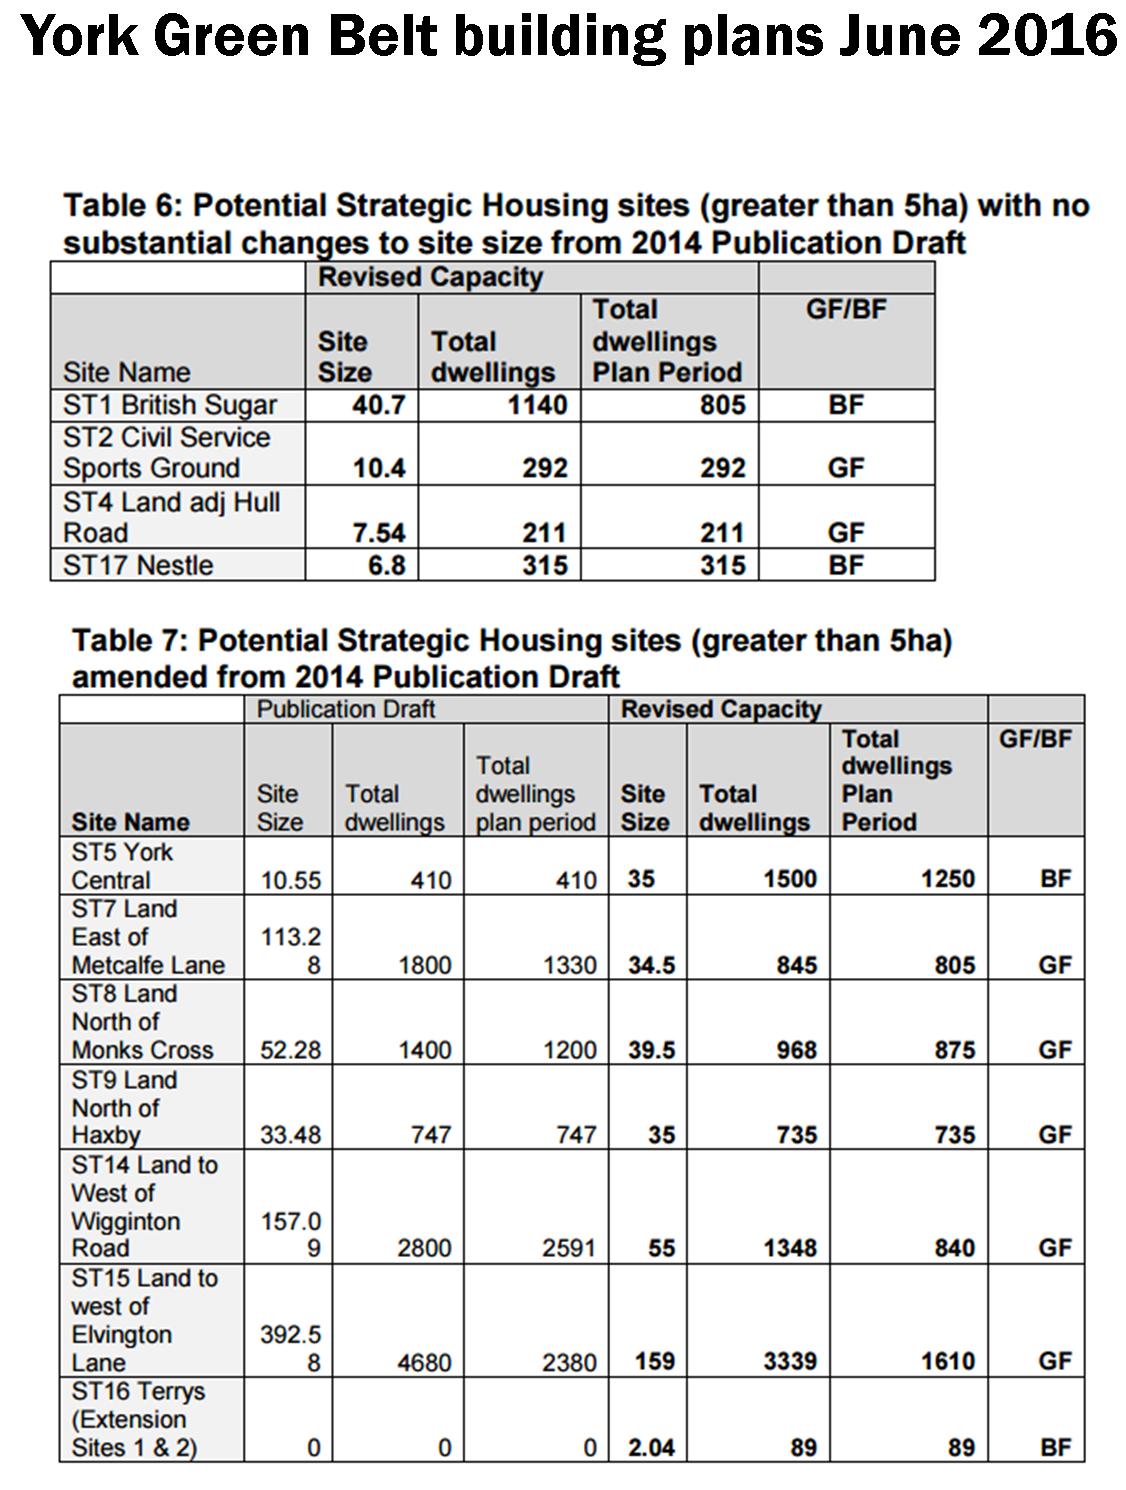
Of the 11 larger sites identified for development, seven currently fall in the Green Belt. These include:
- The Civil Service Sports ground on Boroughbridge Road (292 dwellings),
- Derwenthorpe Two (845),
- Huntington Monks Cross (968) &
- Haxby north (735).
In addition, two new communities are planned.
One is located off Wigginton Road between the City and Skelton (1348) while the other is at Whinthorpe, south of the University near Elvington (3339). The Council papers make no mention of the impact such “villages” – and nearby large employment sites – might have on an already creaking infrastructure.
Some of the smaller housing developments and most of the employment sites are also located in the Green Belt.
Some will feel that the Council should have repudiated the Tory Governments high growth strategy a year of more ago. It may be too late to do so now.
For convenience the changes to land use are summarised below. Detailed maps can be found by clicking here
Green Belt building plans
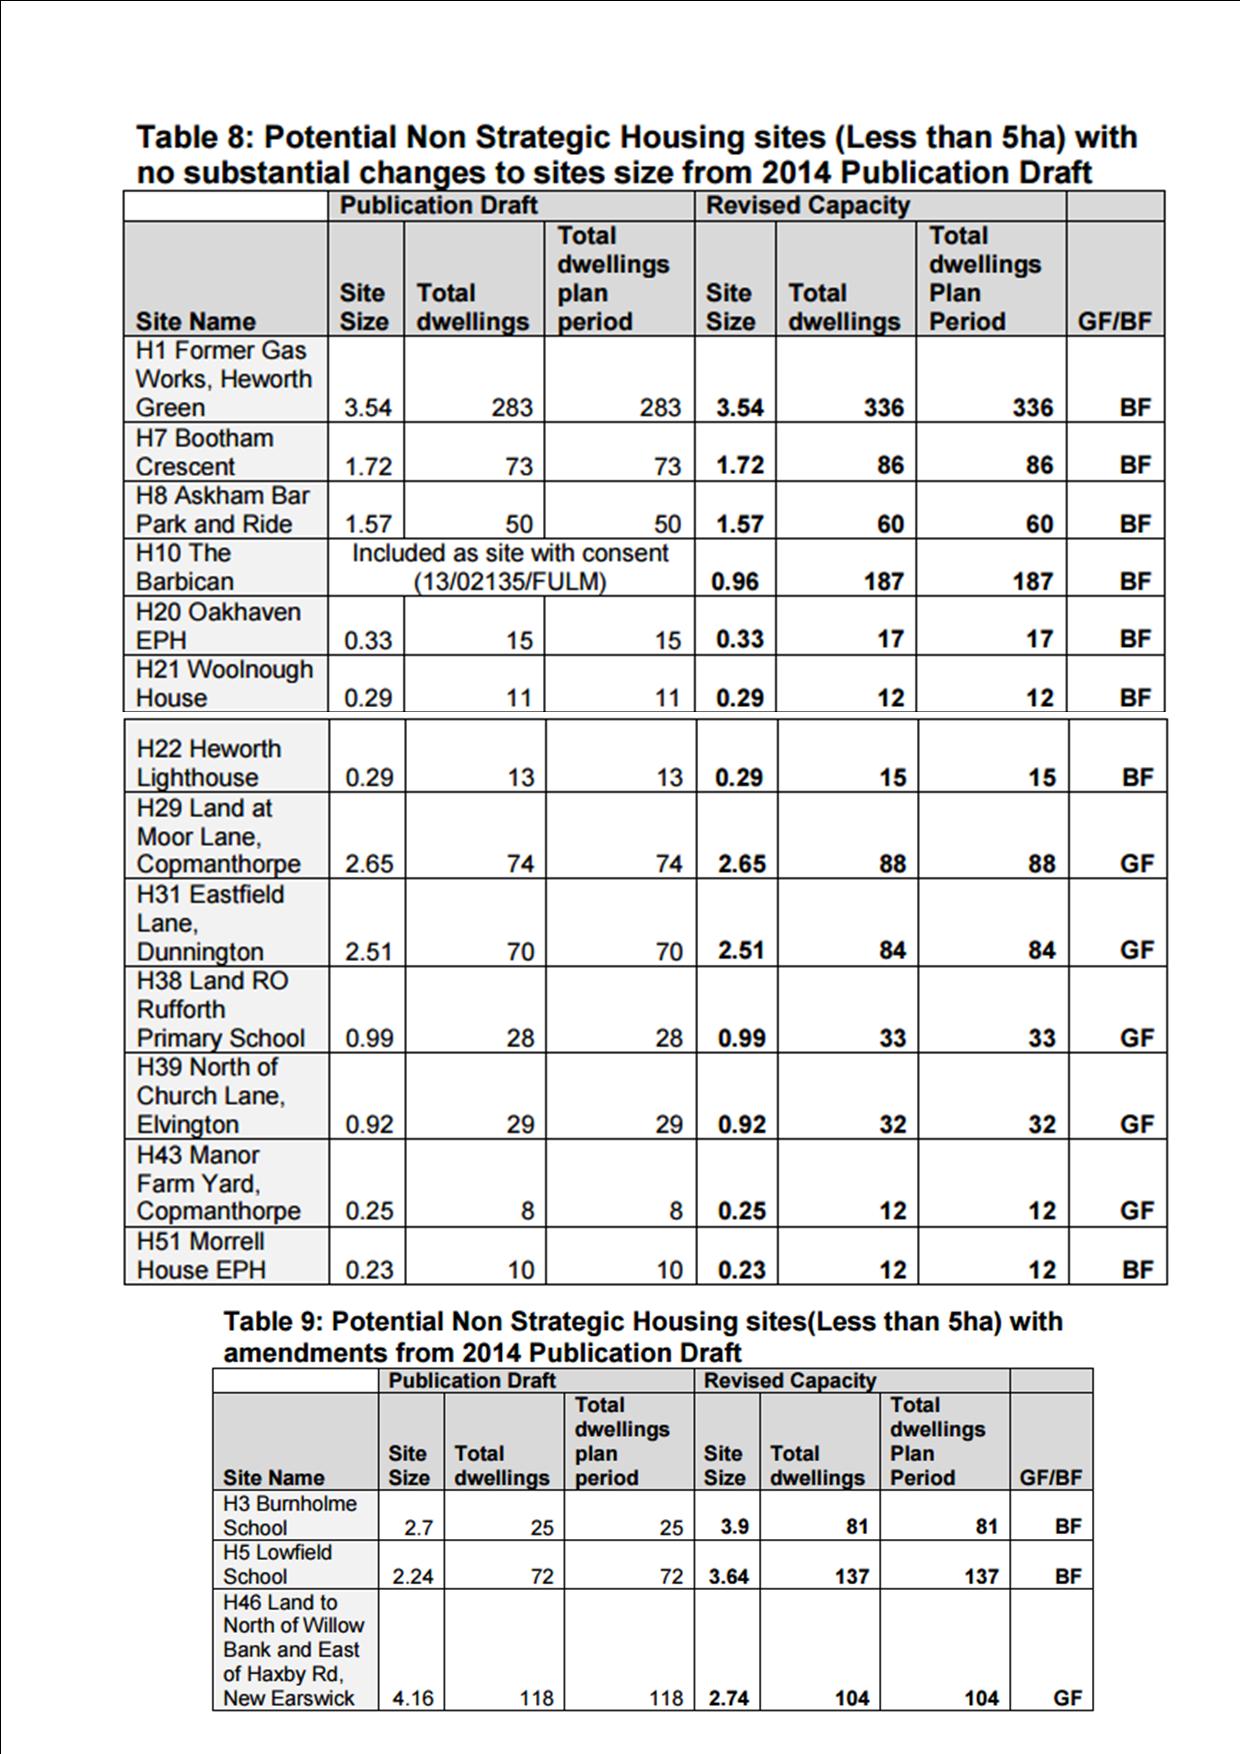
Non strategic housing site
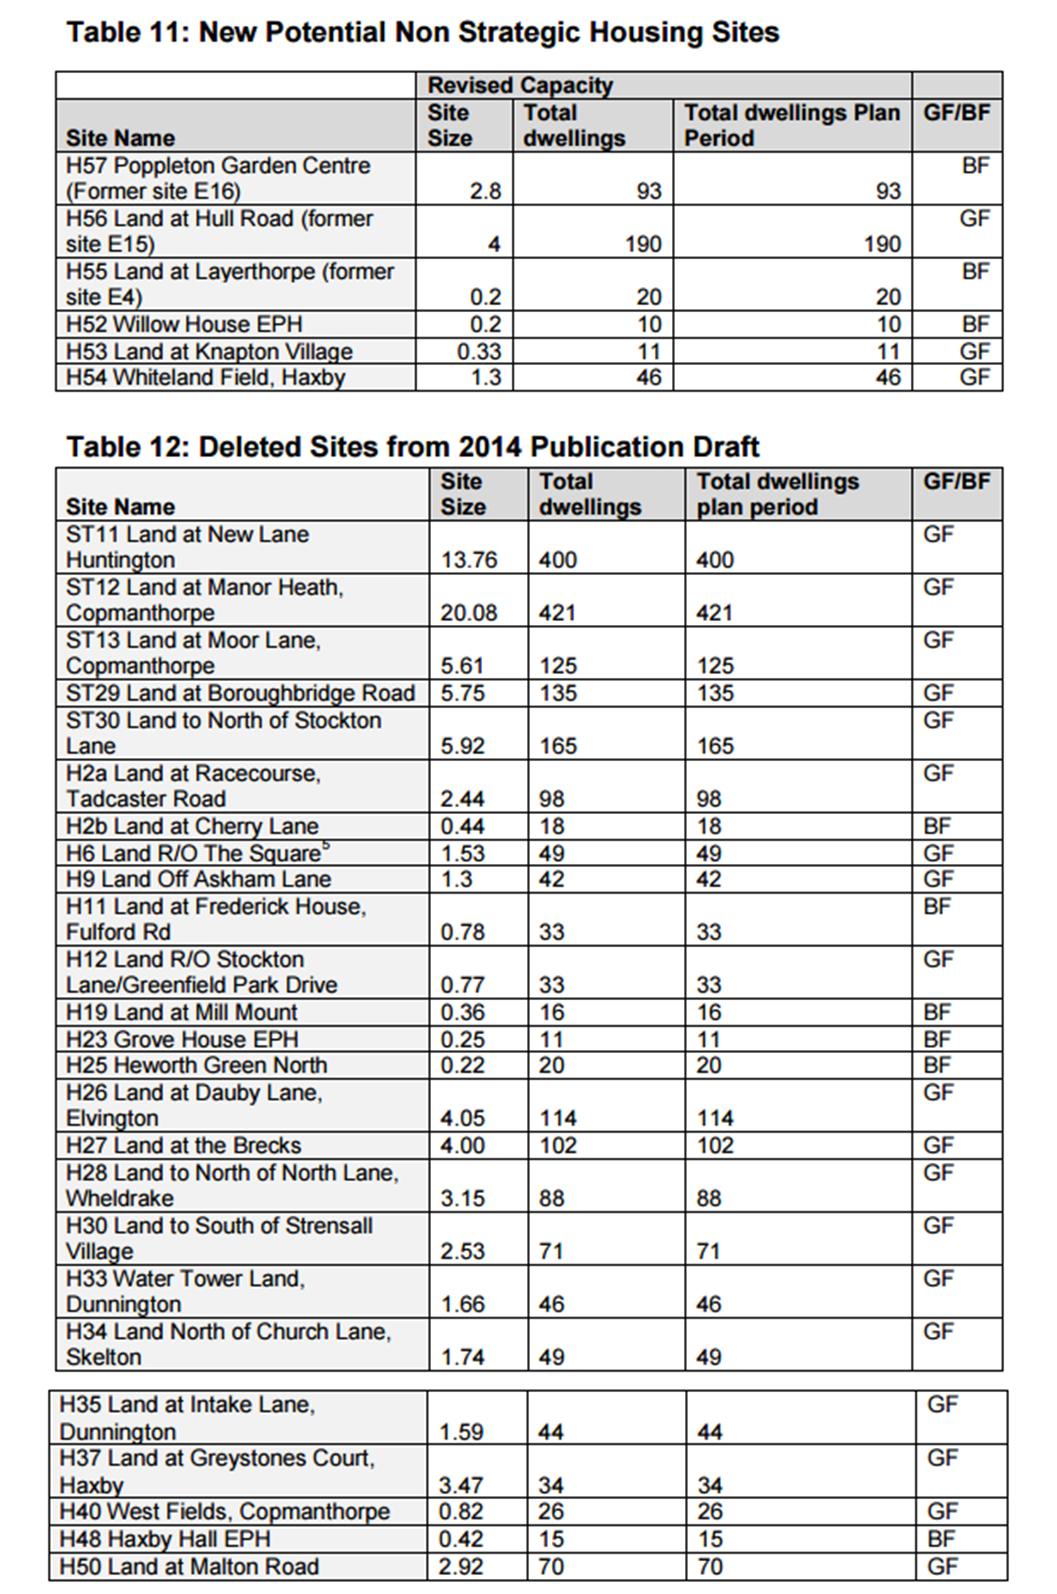
Sites saved from development
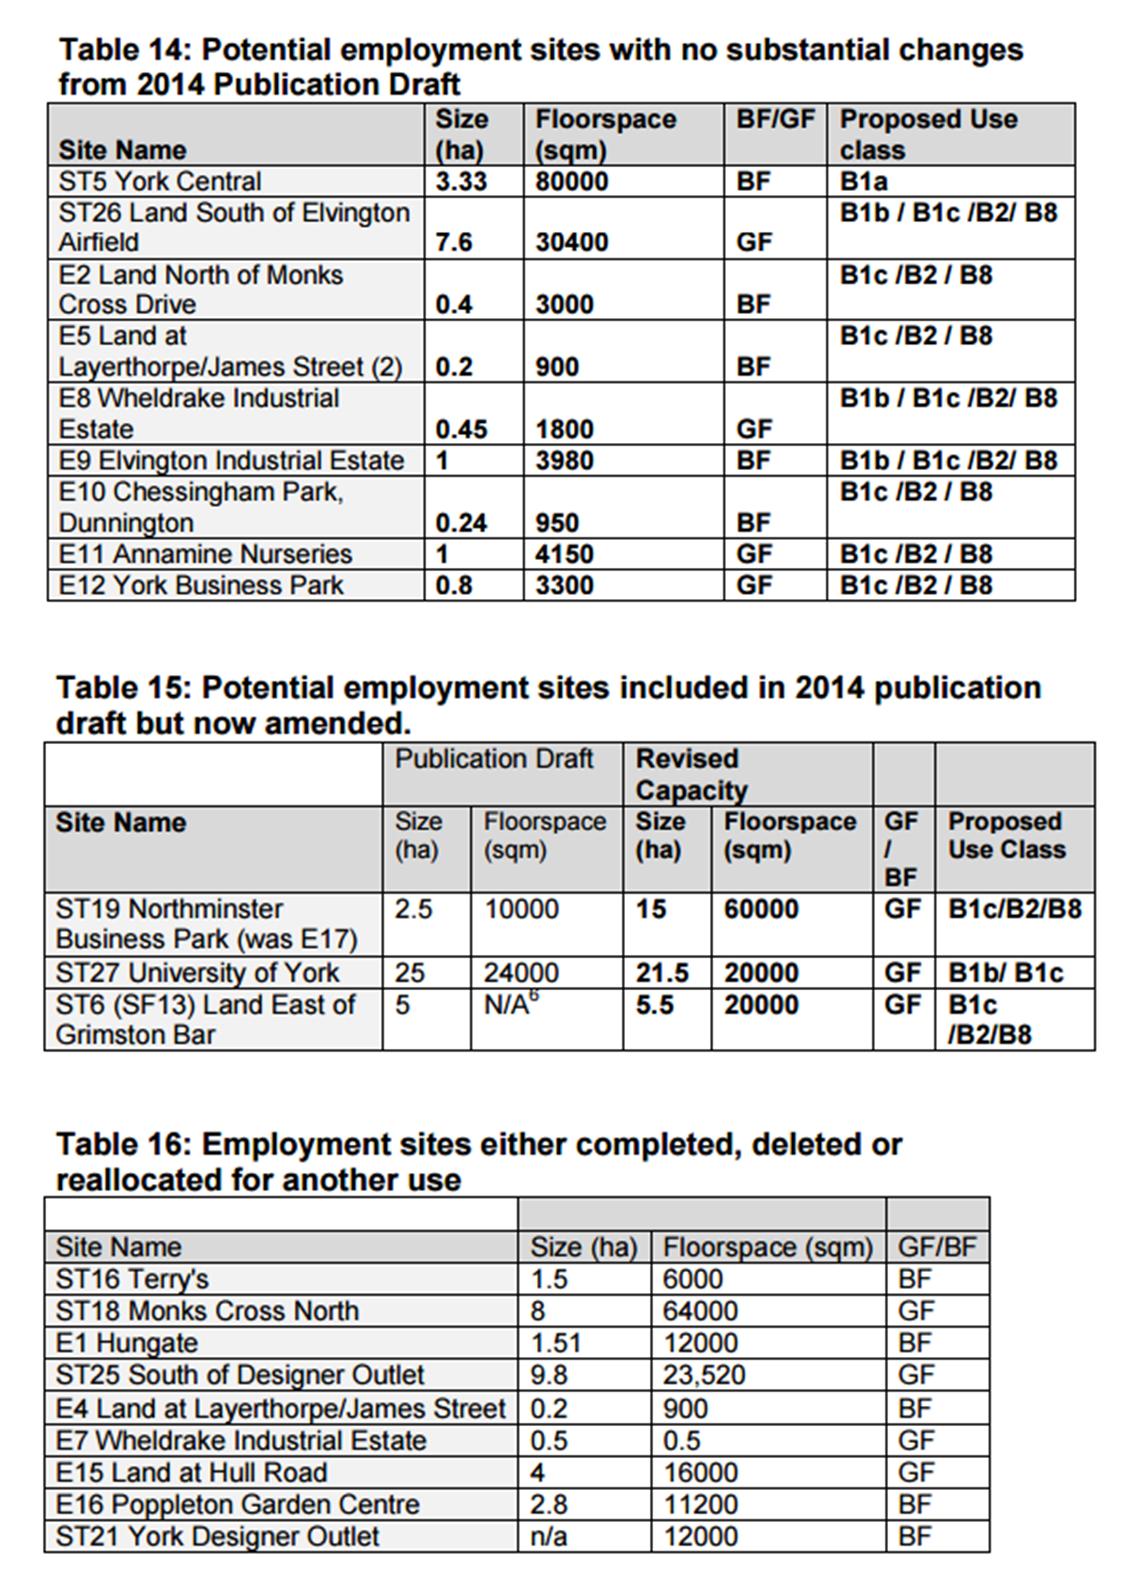
Employment land allocations

 It will be fifth attempt in recent years to come up with a blueprint for the City which seeks both to conserve the natural and built heritage, while making provision for the additional 10,000 or so homes required over the next 20 years to meet the natural growth in population size (excess of births over deaths).