With seemly daily reports in the media about drunken behavior and violence in York city centre, what are the actual crime statistics for the area within the inner ring road?
Fortunately they are readily available on the Police UK web site
The latest monthly figures available cover the month of March.
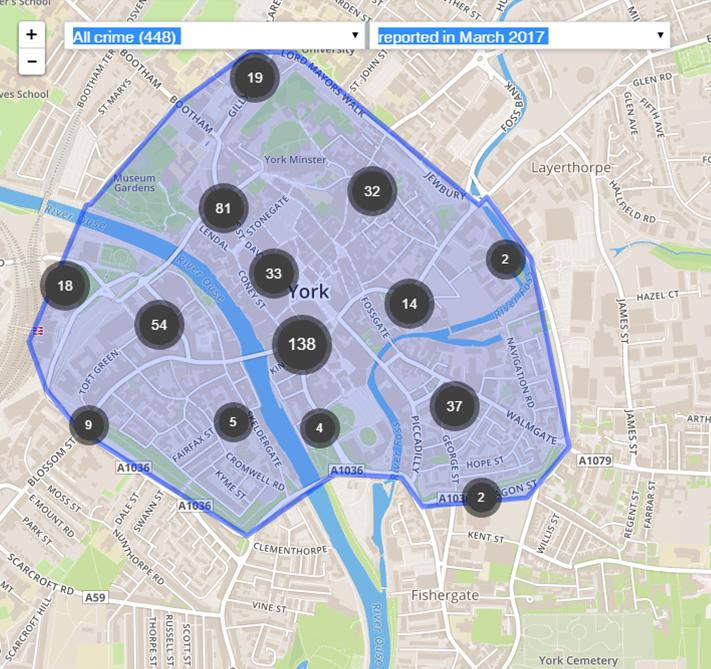
Distribution of crimes
There were 448 crimes reported in March. The majority of these were for anti social behavior,violence and shop lifting.
It was a similar picture during the previous 12 month period
| Crime type |
Total |
Percentage |
| Anti-social behaviour |
2373 |
43.68% |
| Violence and sexual offences |
790 |
14.54% |
| Shoplifting |
649 |
11.95% |
| Other theft |
419 |
7.71% |
| Bicycle theft |
340 |
6.26% |
| Criminal damage and arson |
220 |
4.05% |
| Theft from the person |
173 |
3.18% |
| Public order |
153 |
2.82% |
| Burglary |
120 |
2.21% |
| Drugs |
83 |
1.53% |
| Vehicle crime |
41 |
0.75% |
| Other crime |
35 |
0.64% |
| Possession of weapons |
19 |
0.35% |
| Robbery |
18 |
0.33% |
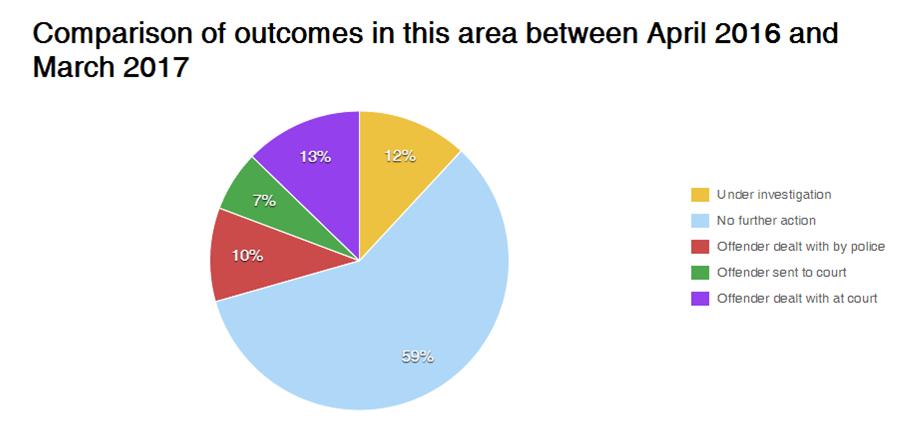
Crime levels usually increase in the summer when larger numbers of people visit the City. Officials will be looking anxiously at the figures for April and May, when any adverse trends may become clearer
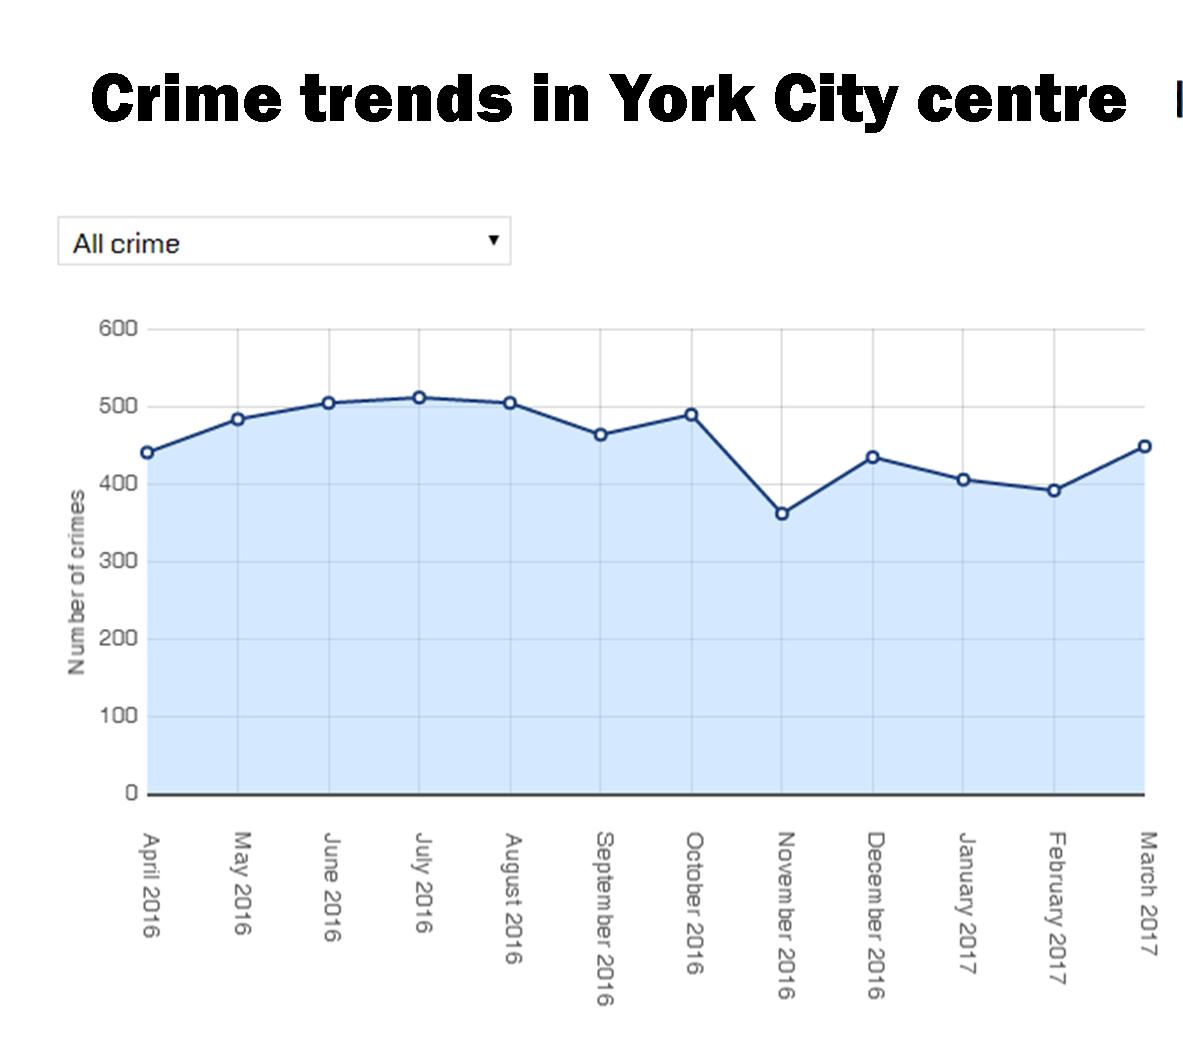
What happens to these arrested?
Some go to court, but most do not!
So who is responsible?
Many of the crimes are fuelled by alcohol.
Here the City Council must take some of the responsibility.
They have cheerfully nodded through more and more licensing applications and have even given planning permission for new premises such as the arts barge whihc will have a bar. They have been recommended to allow up to 5 new licensed premises at the shipping container village which is to be located near the Walmgate trouble blackspot.
Not all licensed premises contribute to the problems but it would be reasonable to ask all four candidates in the forthcoming general election what they want to see done to reassure residents that parts of the City centre are not becoming a “no go zone” during parts of the day.




 We’ve told the York Council on many occasions over the last seven years that it should use some of the profit on its housing account to
