Council releases updated “ward profile” information
 The York Council has updated the “Ward Profile” pages on its open data web site. Residents can view a range of statistics about the area in which they live. Click here https://data.yorkopendata.org/dataset/york-ward-profiles-2018-19-q2
A summary of the information is also provided at City level.
The figures compare local public service standards and residents’ views with the City averages (Westfield figures are shown in brackets in the summary below.
- York has 208,163 residents (14,171) with 5.7% (3.1%) from a black and minority ethnic community group. 83.9% (78.9%) are in good health, with 15.3% (18.8%) stating that they have some limitation in day to day activities.
- £637.58 (£594.62) was the Average Weekly Household Income in 2015/2016 (£629.00 [£580.00] in 2013/2014).
- 66% (57%) own their own home, either outright or with a mortgage, 18% (9%) are private renters and 14% (32%) are social tenants. There are 7,614 Council Houses in York.
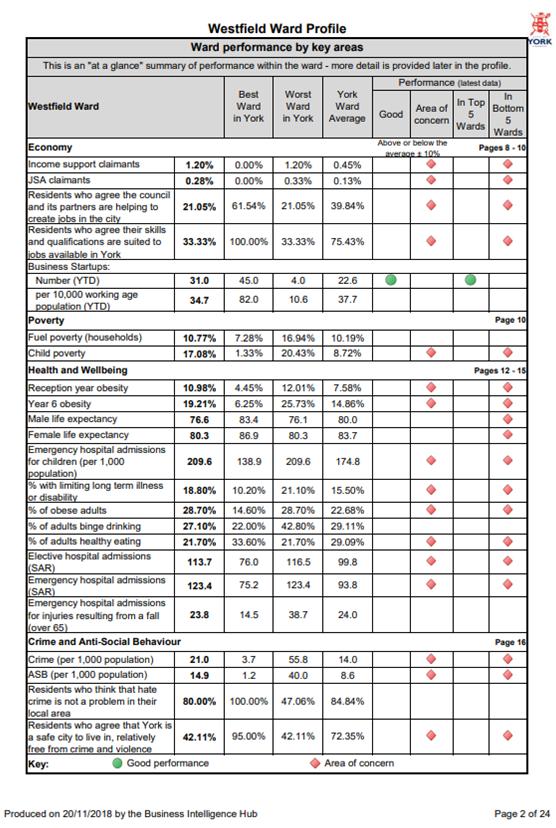
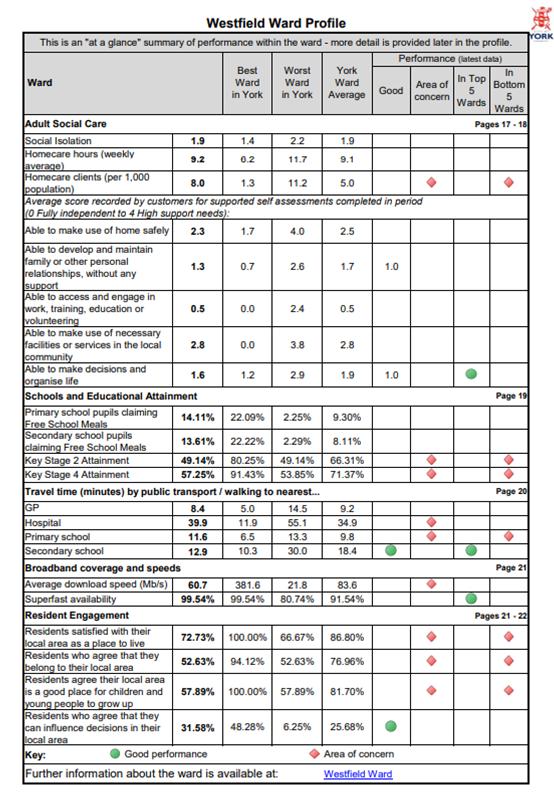
Westfield continues to be the “poorest” ward in the City although average incomes are now steadily rising. It is consistently in the “worst” 5 wards when judged on a range of indicators including the economy, poverty, health & Wellbeing, crime, schools, transport and residents engagement.
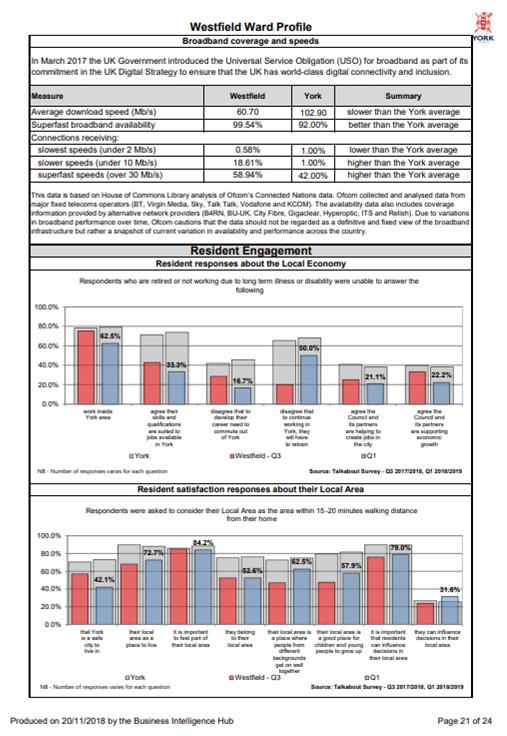
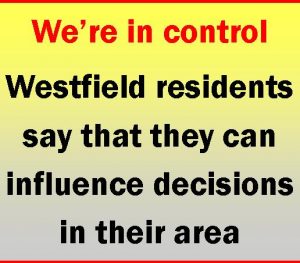
However more people living in the ward agree that they can influence decisions in their local area than the city average.
The area also scores well on the availability of “superfast broadband”, travel times to secondary schools and business starts ups while most social care stats are positive.

The numbers unemployed have also fallen dramatically over the last 2 years.
Perhaps the biggest underlying problem is health, with 35% of children judged to be overweight. The area also has the largest proportion of overweight adults. Life expectancy is below average for both male and females. These figures will add to criticism of the York Councils decision to reduce the amount of open and sports space available in the ward.
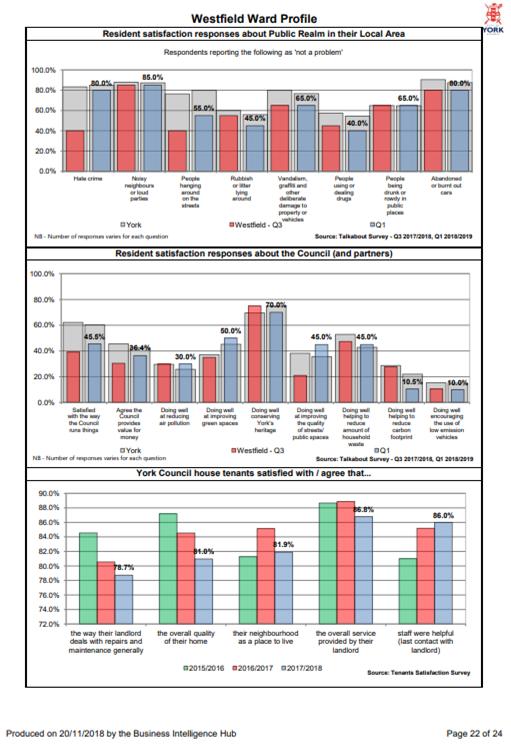
Satisfaction with the Council as land lord is declining according to tenants’ views. Lack of car parking dog fouling and drug use are cited as significant issues in some areas.
All in all, the figures make interesting reading although the major impression is that things have improved over the last year or two.
