Unidentified object flies over Guildhall

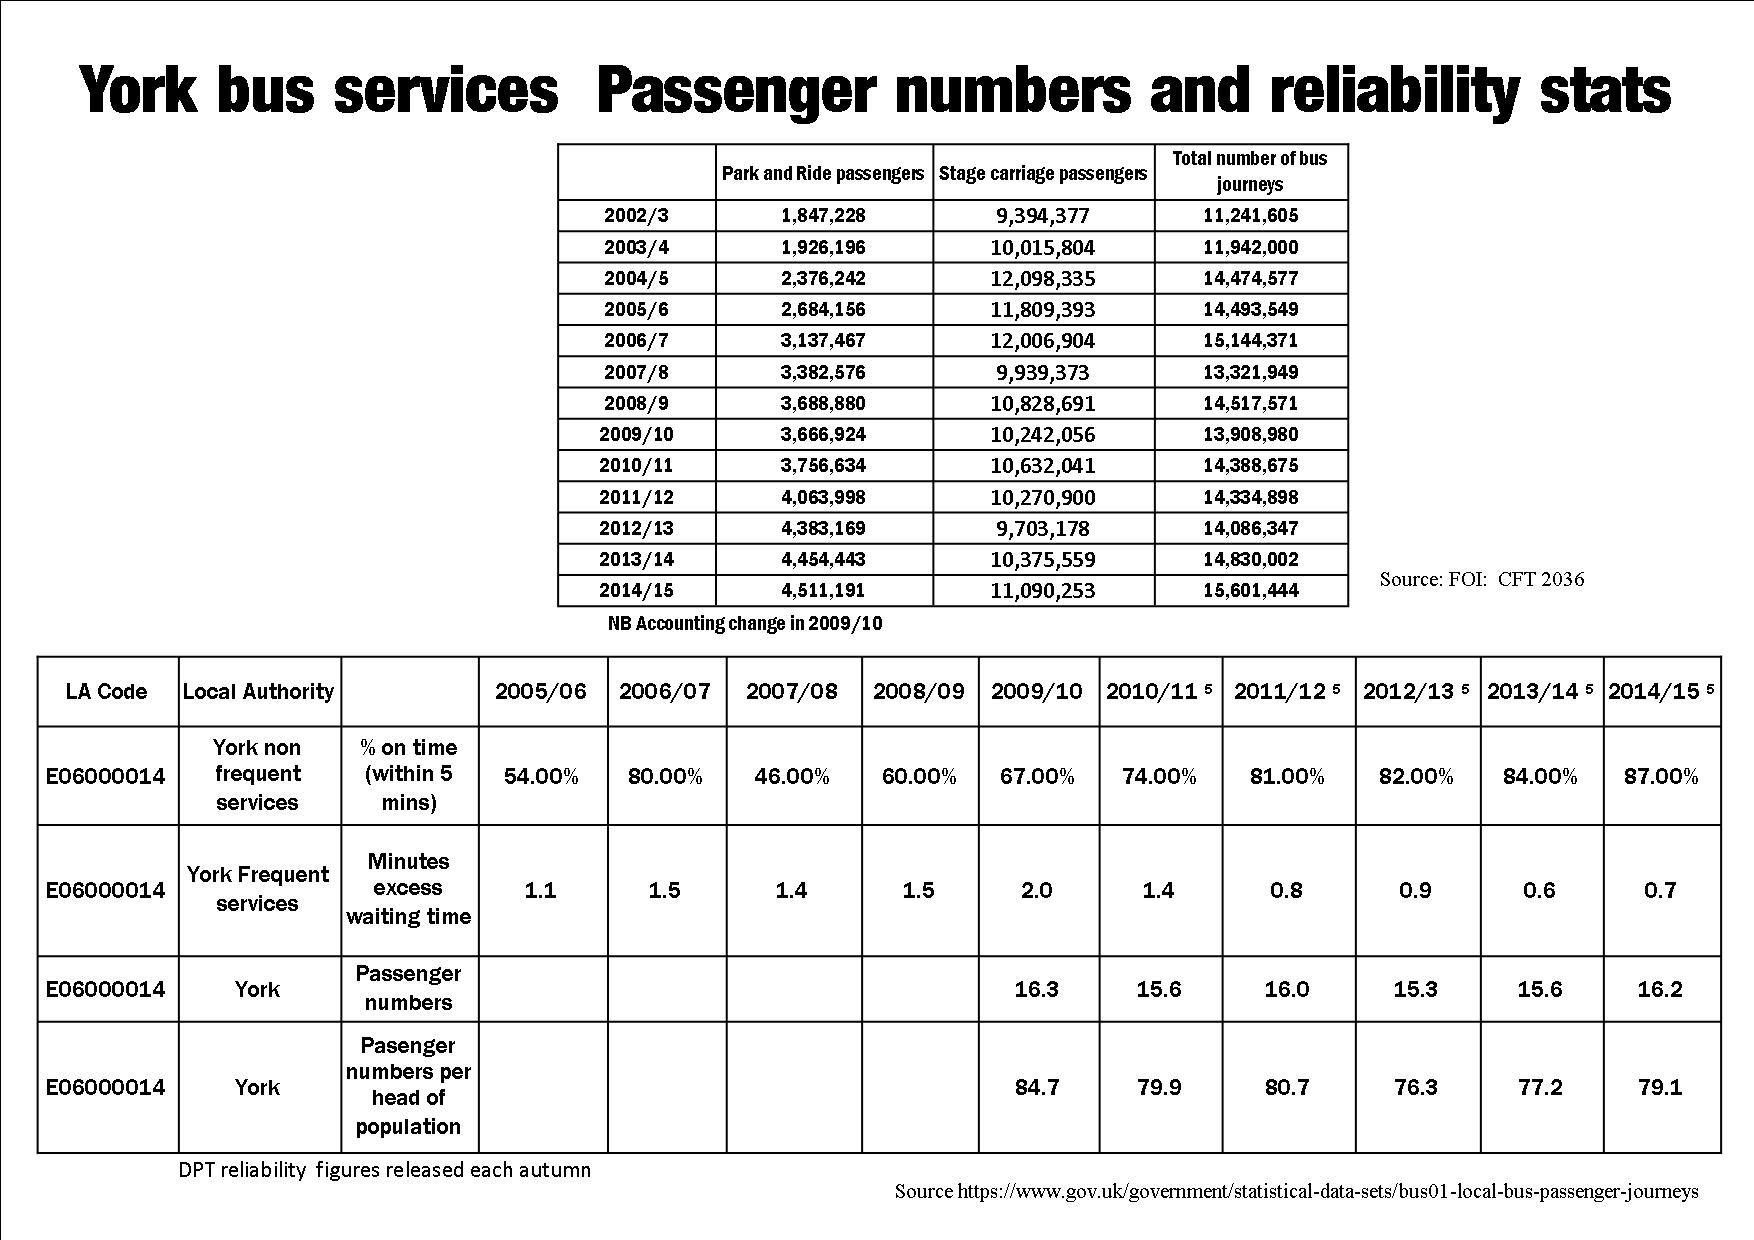
Relative too many other areas, York’s bus services have achieved higher passenger numbers (per head of population) for almost 15 years.
Although down from the high of 12 million passengers carried in 2006, stage carriage services still managed to attract 11 million users last year. On top of this, the expansion in Park and Ride continues with 4.5 million using the enlarged network last year.
At a time when the annual DpT statistics see bus services losing passengers in some other Cities, this is a cause for some relief in York and the Council might claim justification in celebrating its relative success through a media release (see below right)
It is being disingenuous in suggesting that passengers can expect to wait less than a minute for bus services to arrive or that timetabled services are 87% reliable. That simply isn’t the case at the times of the day, and seasons of the year, when people travel most.
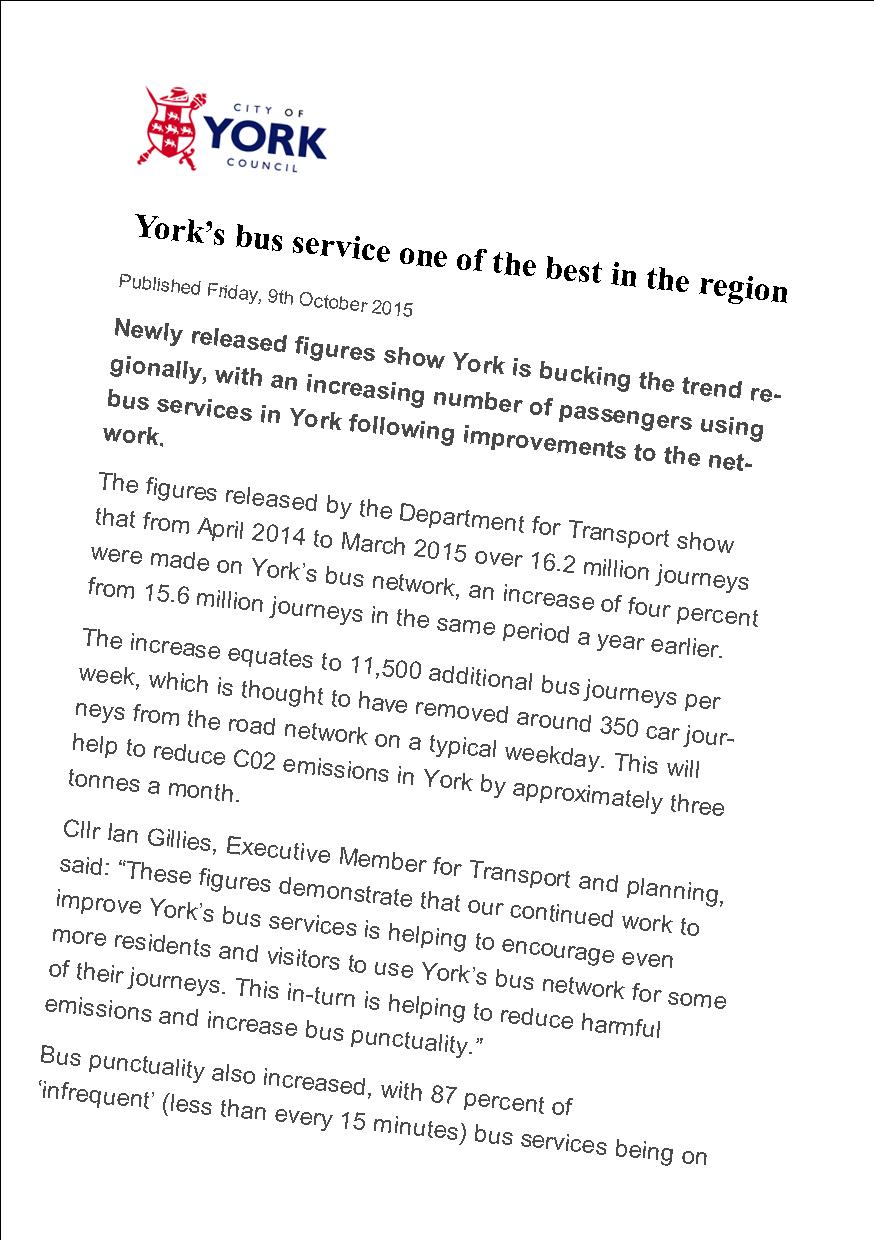
Media release by York Council 9th Oct 2015
The claims are based on DpT published statistics which can be found by clicking here for waiting times and here for passenger numbers
The reliability figures are the result of a one off check undertaken by the local authority in the autumn of each year (usually the least busy time on the highways network).
Sadly with the York Councils supposedly independent scrutiny committee system bogged down with trivia, it seems unlikely that anomalies like these will ever be challenged. Most scrutiny committee chairs seem to back away for even asking for regular quality of service reports. That leaves consumers in the dark – none more so than on bus service reliability.
The sooner that the figures collected each day by the “Your Next Bus” computer systems are routinely published, the sooner we are likely to get a more candid analysis of both the Councils performance and that of York’s bus operators.
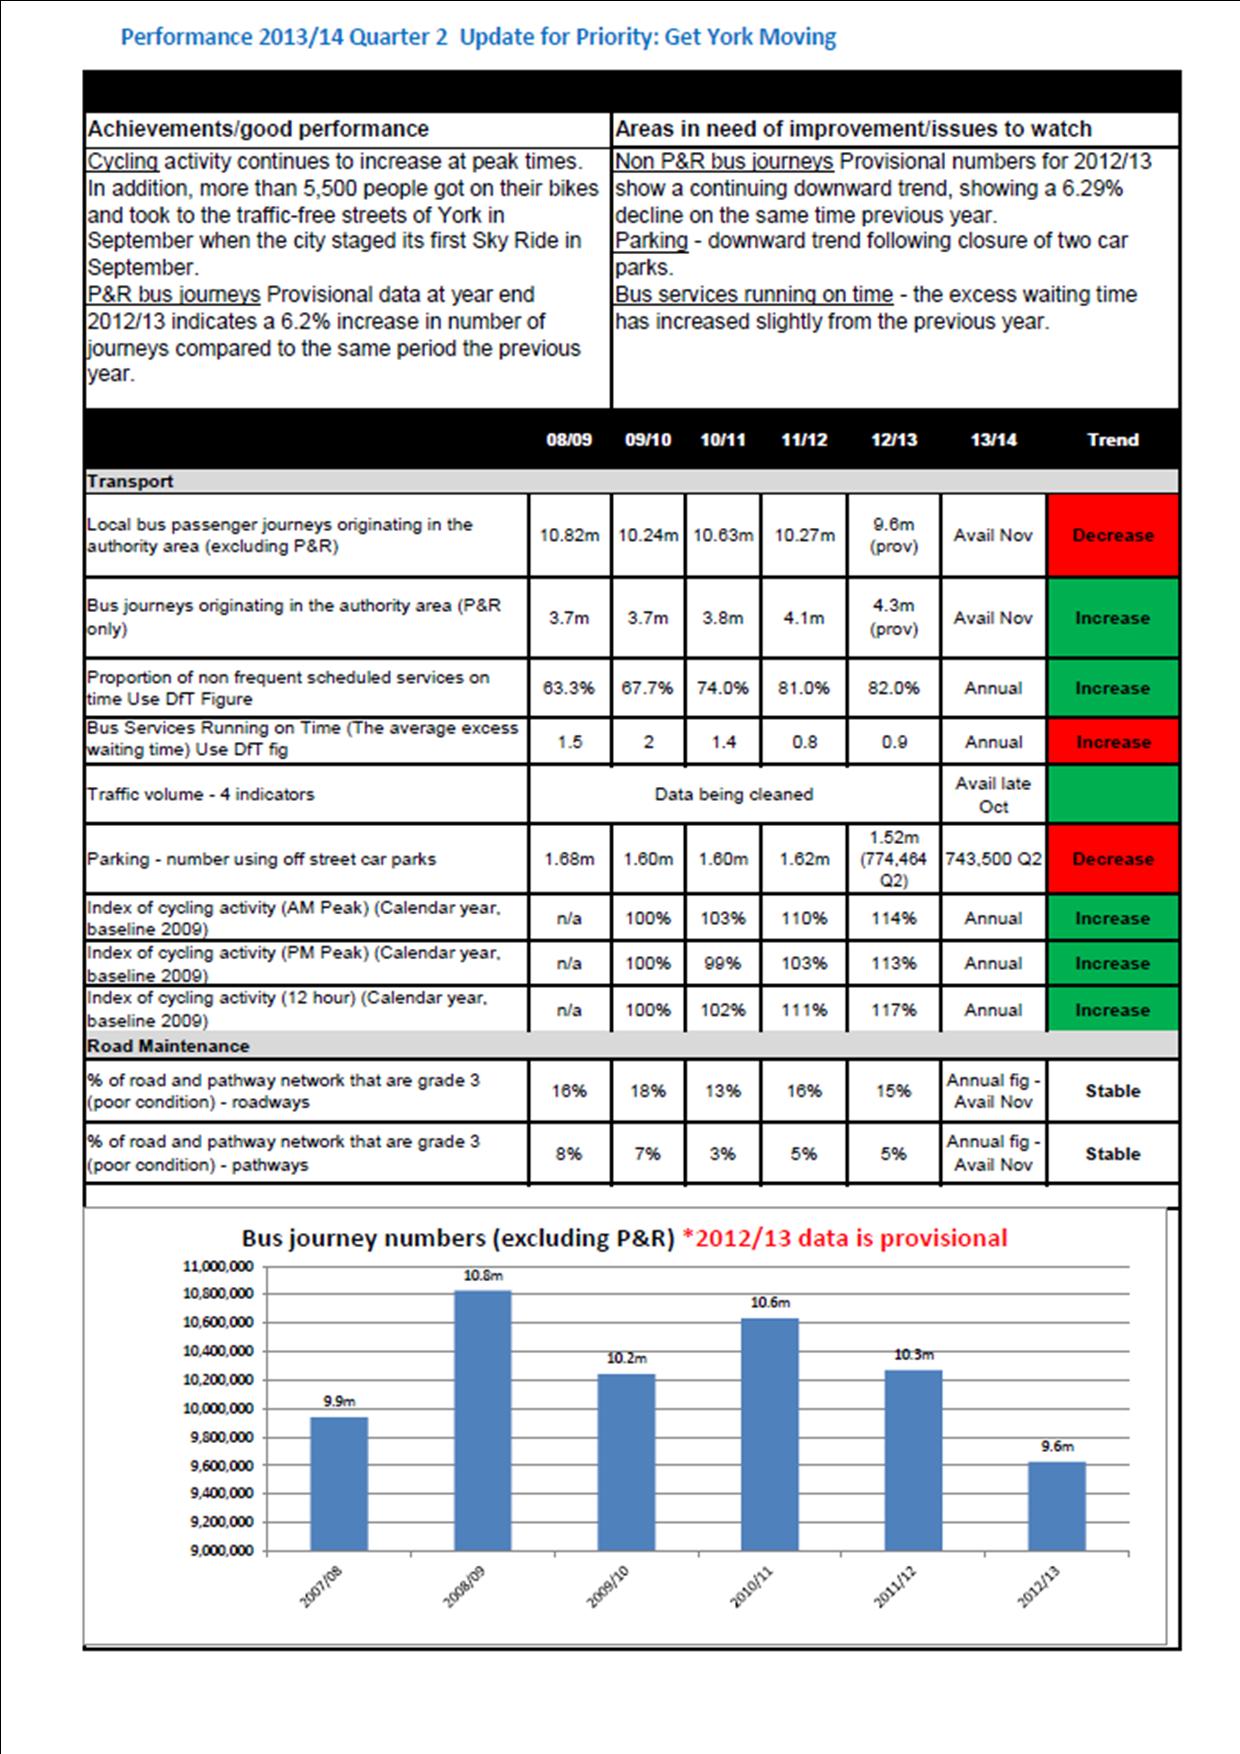
Bus service performance stats provided by York Council and Department of Transport