Deaths
FOUR (4) additional deaths have been reported by the York Hospital Trust today. Two occurred on Wednesday and two yesterday.
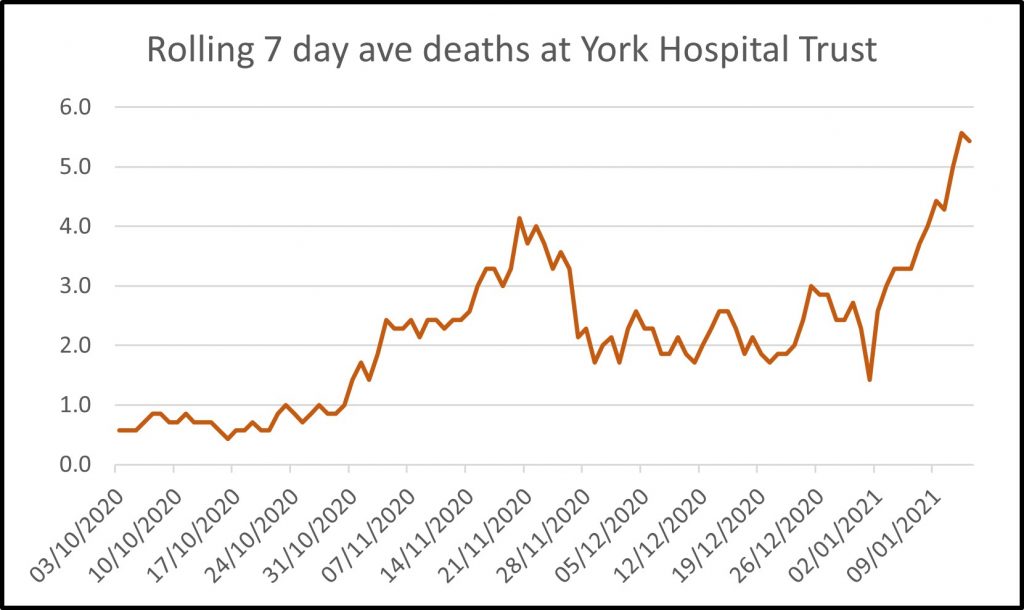
The cumulative number of COVID fatalities since 1st September is now 239.
NB. These are not all York residents.
Comparing the latest validated figures for York resident registered deaths ( week ending 8th January) there were 8 hospital deaths recorded.
During the same week the York Hospital Trust declared a total of 16 fatalities.
Test Results
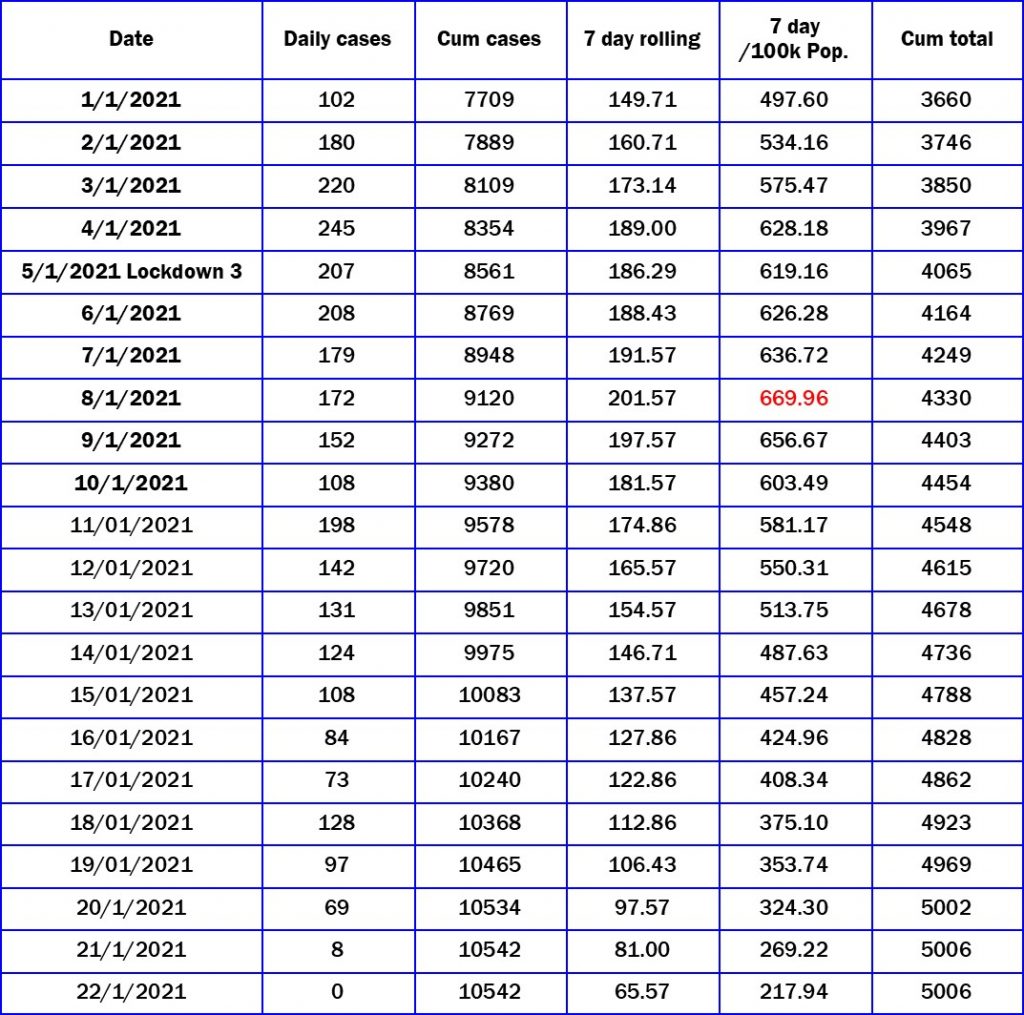
SEVENTY SIX (76) additional positive test results were announced today. The cumulative total is now 10,542
The current rate /100k population figure is 408.34.
This is expected to trend down to below 350 over the next couple of days.
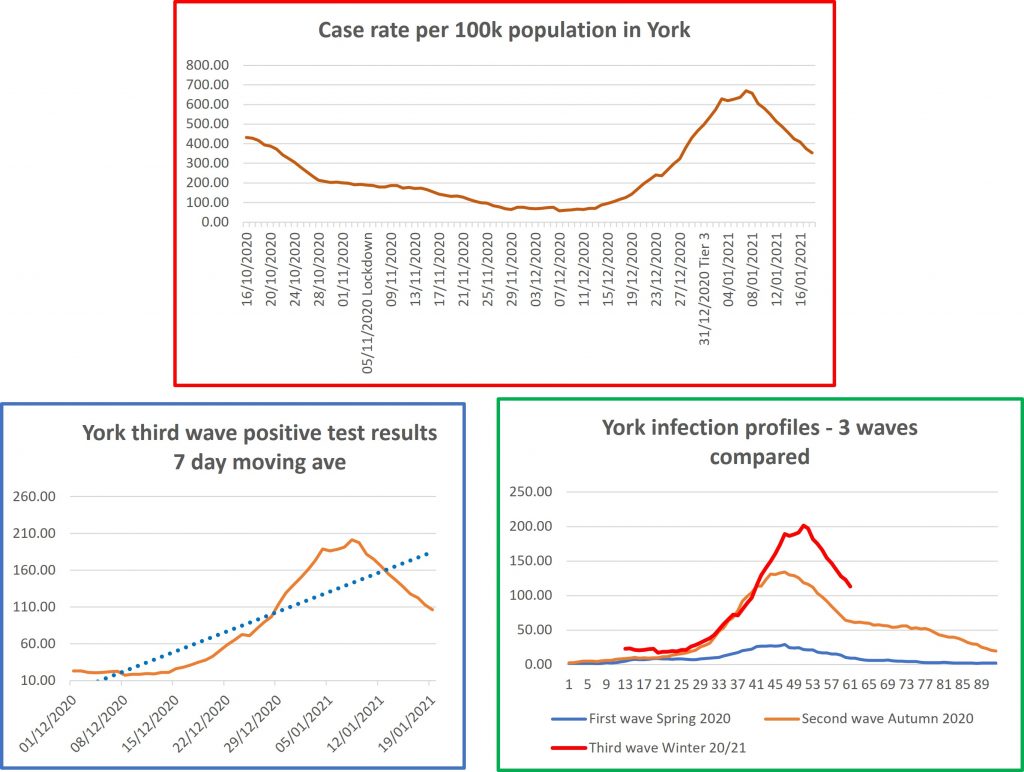
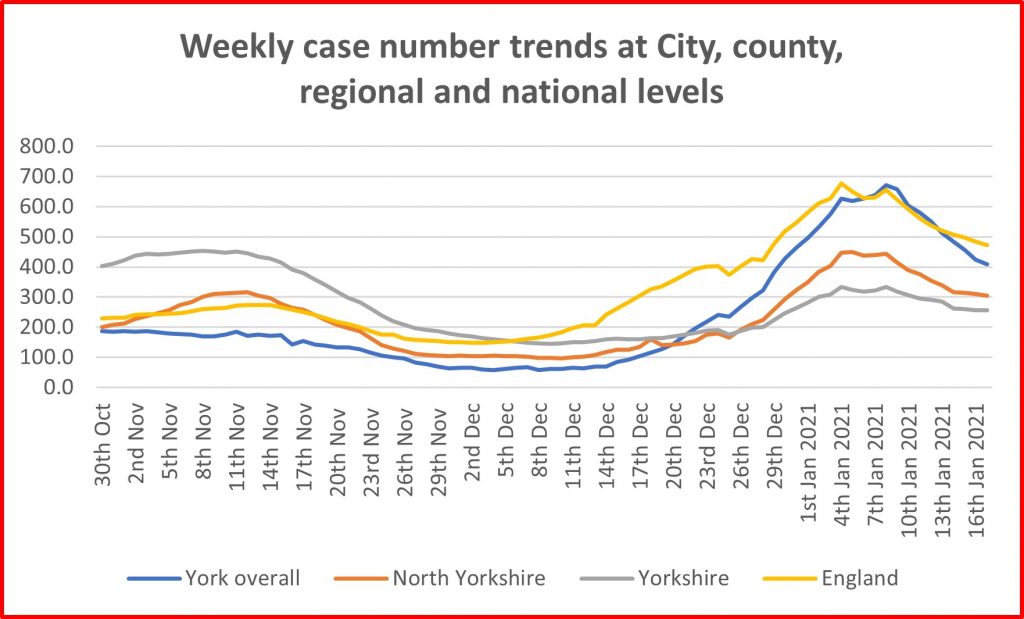
Infection rates in the City are now falling faster than is being seen at county, regional and national level.
Hospitals
According to government issued figures, there are currently (19/1/21) 205 COVID patients being cared for by the York Hospital Trust
Neighbourhoods
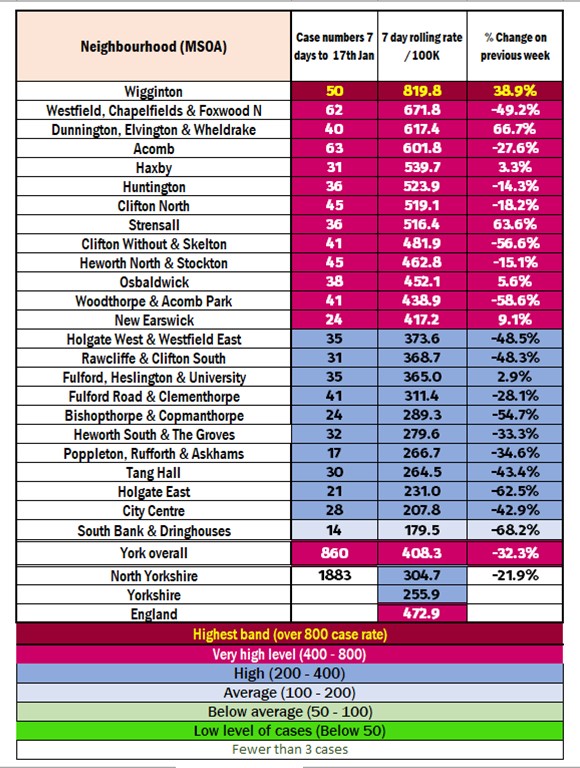
Wigginton remains the only area with a case rate in excess of 800. It has two fewer cases than were recorded on the previous day.
Case numbers in Foxwood North/Westfield/Chapelfields have fallen from a peak of 144 ,seen on 8th January, to 62 on 17th January.
The lowest infection rate (179.5) can now be found in the South Bank/Dringhouses area
Vaccinations
According to the latest Council update (see below) as at 18th January
- “17,341 CYC residents had received the first dose and 1,015 had received both doses.
- 8,999 people over 80 have received the first dose. This represents 79.4% of the estimated number of people aged over 80 in York (11,334 people).
- 664 people aged 65+ who live in care homes have received the first dose”.
Tabulated local information is still not published although the York Council are now claiming that 80% of over 80’s have now been immunised
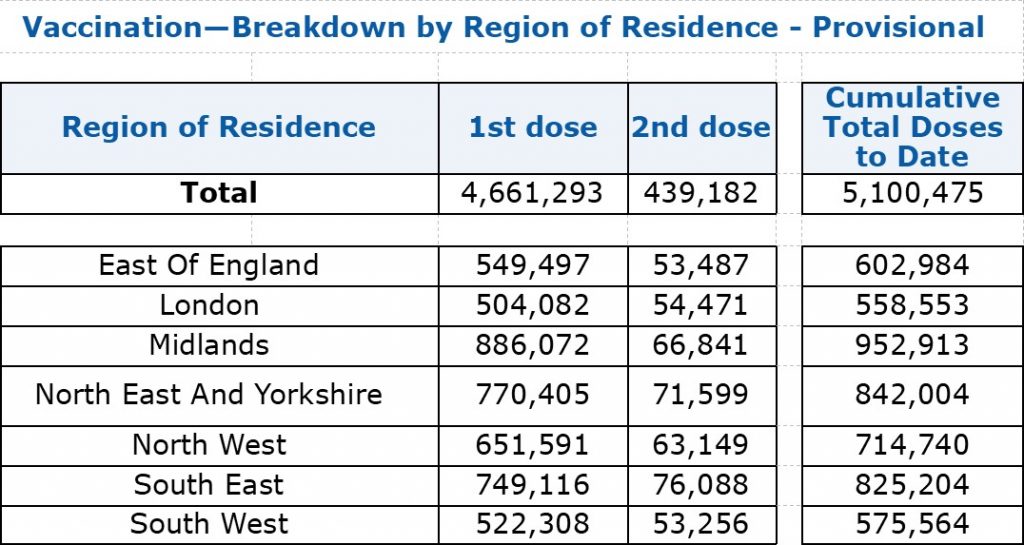
The latest vaccination figures published by the NHS today are reproduced below.
Testing
Council commentary updated
The York Councils commentary on Coronavirus has been updated on its open data site
The briefing does refer to infection rates in “wards” This is not correct. Statistics are reported by Middle Layer Super Output Areas (MSOA) boundaries (which are very different from ward boundaries). MSOAs are a feature of census data gathering protocols.
People with Covid Symptoms
• NHS Pathways/111 triages – as at 18.1.21 there had been 267 total covid triages in the CYC area in the last 7 days. The peak number of triages was 653 in the 7 day period to 20.9.20.
• As at 20.1.21, the Covid Symptom App estimates 733 per 100,000 in York with symptomatic covid (responses from a sample of 4,840 people). The peak rate was 1,282.6 on 7.1.21.
Diagnosed cases
• As at 21.1.21 York has had 10,466 cases since the start of the pandemic, a rate of 4,969.2 per 100,000 of population. The cumulative rate in York is below the national (5,493.24 and regional (5,531.1) averages.
• The PHE ‘Exceedance’ rating compares the no. of new cases over a 14 day period with the previous 6 weeks and provides a RAG rating to indicate if the previously observed trend in the no. of new cases is worsening. The latest rating for York (18.1.21) is Green.
• The provisional rate of new Covid cases per 100,000 of population for the period 13.1.21 to 19.1.21 in York is 347.1 (using data published on Gov.uk on 21.1.21).
• The latest official “validated” rate of new Covid cases per 100,000 of population for the period 10.1.21 to 16.1.21 was 424.5. The national and regional averages at this date were 484 and 257.3 respectively (using data published on Gov.uk on 21.1.21).
• York is currently ranked 65th out of 149 Upper Tier Local Authorities (UTLAs) with a rank of 1 indicating the lowest 7 day rate.
• For the 7 day period 9.1.21.to 15.1.21, 10 wards in York (Acomb, Westfield, Rawcliffe & Clifton Without, Dringhouses & Woodthorpe, Wheldrake, Holgate, Rural West York, Guildhall, Bishopthorpe and Micklegate) have seen a statistically significant fall in rates compared with the 7 day period 2.1.21 to 8.1.21. For the remaining wards there has been no statistically significant change in rates. No wards have seen a significant increase in rates.
• The rate of new Covid cases per 100,000 of population for the period 10.1.21 to 16.1.21 for people aged 60+ in York was 397.4. The national and regional averages were 383 and 201.1 respectively.
• As at 18.1.21, the latest 7 day positivity rate in York (Pillar 2 PCR tests only) was 12.9%. The national and regional averages are 14.2% and 10.2% respectively.
• As at 18.1.21 the latest 7 day positivity rate in York (Pillar 2 Lateral Flow Tests only) was 1.18%. The national and regional averages are 1.1% and 0.6% respectively.
• As at 19.1.21, the latest 14 day positivity rate in York (Pillar 1 and 2 PCR tests combined) was 13.5%. The national and regional averages were 14.5% and 10.3% respectively. The breakdown for York over the last 14 days is a 9.5% positivity rate for Pillar 1 tests and a 14.4% positivity rate for Pillar 2 PCR tests. Source PHE
• As at 21.1.21 York University reported 41 individuals within the University community who were currently self-isolating because they have had a positive COVID-19 test. The peak number was 331 on the 19.10.20.
• As at 18.1.21 York St. John reported 4 individuals within the University community who were currently self-isolating because they have had a positive COVID-19 test. The peak number was 82 on the 8.10.20
Contact Tracing
• Since 28.5.20 a total of 9,453 laboratory confirmed CYC Covid cases have been uploaded into the NHS Test and Trace system and 8,480 of the cases have been completed (89.7%). 22,810 ‘contacts’ have been identified and 16,736 of these have been completed (73.4%). Source: PHE Report.
• Local Tracing of Cases: Between 22.10.20 and 15.1.21, 711 ‘actionable’ positive COVID-19 CYC cases have been referred to the local contact tracing service. 688 of the referrals (96.8%) have been actioned and 23 are still ‘in progress. Of the referrals actioned, 469 (68.2%) were successful and 219 (31.8%) were unable to be reached via phone or home visit, but guidance leaflets were posted where possible.
Cases in Residential Settings / Schools
• As at 21.1.21 there were 10 care homes in the CYC area with confirmed Covid-19 infection (at least 1 case of either a staff member or resident).
• The latest ‘outbreak’ (2+ cases) in a residential care setting in York was reported by PHE on 21.1.21 (2 homes).
• In the 7 days up to 17.1.21 there were 44 children of primary and secondary school age who tested positive (across 25 different schools). NB Currently the majority of York children are not in the school setting.
COVID Bed Occupancy in York Hospital
• As at 20.1.21 there were 155 confirmed Covid-19 patients in General and Acute beds. The previous figure on 19.1.21 was 157
• As at 20.1.21 there were 8 confirmed Covid-19 patients and 0 suspected Covid-19 patient in the Intensive Treatment Unit. The previous figures on 18.1.21 were 5 and 1 respectively.
• As at 20.1.21 there had been 0 patients admitted with suspected Covid-19 and 5 with confirmed Covid-19 in the previous 24 hours.
• As at 20.1.21 there had been 14 confirmed patients discharged with COVID-19 in last 24 hours
R Number
• The ‘R’ value (the number of people that one infected person will pass on a virus to, on average) for the North East and Yorkshire area on 15.1.21 was estimated to be in the range 1.1 to 1.3. The previous estimate was (1.1 to 1.4) on 8.1.21.
Vaccinations
• As at 18th January 17,341 CYC residents has received the first dose and 1,015 had received both doses. 8,999 people over 80 have received the first dose. This represents 79.4% of the estimated number of people aged over 80 in York (11,334 people). 664 people aged 65+ who live in care homes have received the first dose.
• In England between 8.12.20 and 20.1.20, 4,740,578 vaccinations had been administered (4,303,730) first dose and 436,848 second dose).
Deaths
The two sources about deaths from Covid-19 at LA level are ONS data and local registrar data. They are derived from the same source (civil registration data). ONS data is more comprehensive as it includes deaths of York residents which have occurred and been registered outside York. Local registrar data is useful as it enables a breakdown by age and gender. The most recently available data is summarised below:
• ONS weekly data: In the most recent week (2.1.20 to 8.1.20) 8 Covid-19 deaths were recorded as having occurred for CYC residents (all in hospital).
• ONS Cumulative data: Since the start of the pandemic, for deaths occurring up to 8th January 2020 and registered up to 16th January 2021, 238 Covid-19 deaths were recorded as having occurred for CYC residents (128 in hospital, 91 in care homes, 13 at home and 6 in a hospice). The number of deaths per 100,000 of population in York is 113 which is lower than the national average of 145.3.
• ‘Excess’ deaths – all causes (ONS). In 2020 there were a total of 165 ‘excess deaths’ in York in 2020 compared with the average weekly numbers for 2014-2018. The breakdown over the year is: 18 fewer deaths in weeks 2-14, 210 more deaths in weeks 15-21 (when covid deaths were at their peak) and 27 fewer deaths in weeks 22-53.
• Local Registrar data (Cumulative): Since the start of the pandemic (using data for deaths occurring up to 13.1.21), a cumulative total of 241 deaths of CYC residents where COVID-19 was mentioned (confirmed or suspected) on the death certificate, have been registered. The average age of the people who died was 82, with an age range of 44-104. The age profile of those dying in York is older than the national average. 117 of the 241 were male (48.5 %), less than the national average (55.1%). 86 people (35.7%) died in nursing /care homes; (the national average is 24.37%). In addition 20 people (8.3%) who normally resided in nursing/care homes in the CYC area, died in hospital.