430,727 hours devoted to home care in York each year

elderly_care
The total hours of home care commissioned by the York Council in 2011/12: 430,727

The proportion of those hours which were commissioned for each of the following client groups:

People aged 65 and over numbers of customers 794, intensive 208, (79% of hours commissioned)

People aged 18 – 64 with a Learning Disability number of customers 128, intensive 113 (3% of hours commissioned)

People aged 18 – 64 with Mental Health needs number of customers 18, intensive 1 (1% of hours commissioned)

People aged 18 – 64 with a Physical Disability number of customers 128, intensive 52 (17% of hours commissioned)

Labour cuts in York Arts staffing revealed

The cuts that the Labour Council in York plan to make to the Arts have been published following a private meeting.

Changes to the Music Service can be found by clicking here

Separately a new team is created by, as the Council claims, “bringing together Arts, Heritage and Culture functions with City Centre and Markets services charged with the delivery of a high quality city centre offer. As part of the restructure a saving of £20k will be realised”.

Details can be viewed by clicking here

York Green Belt IS protected

As Labour become ever more desperate in their attempts to justify their “high growthLocal Plan, one mantra that keeps being repeated in that York “doesn’t have a Green Belt”.

In fact, York has had a (draft) Green belt for several decades. There are many planning decisions (important precedents) which revolved around development being refused because of its effect on the Green Belt.

The Green Belt received regional recognition – and protection – in the “Yorkshire and Humber Regional Spatial Strategy” (RSS) which was adopted in 2007.

Although the RSS was overtaken by the Localism Act (the present governments attempt to give more power to local communities), the York Green Belt boundaries were quite specifically recognised and protected when the new legislation was enacted.

Details can be found on this Government web site
http://www.legislation.gov.uk/uksi/2013/117/note/made</a>

The government’s explanatory note reads,

Section 109 of the Localism Act 2011(1) abolished the regional planning tier by repealing Part 5 of the Local Democracy, Economic Development and Construction Act 2009(2) (which only applied in relation to England). This includes the removal of the responsible regional authorities. Section 109 also made provision to revoke or partially revoke, by order, the eight existing regional strategies.

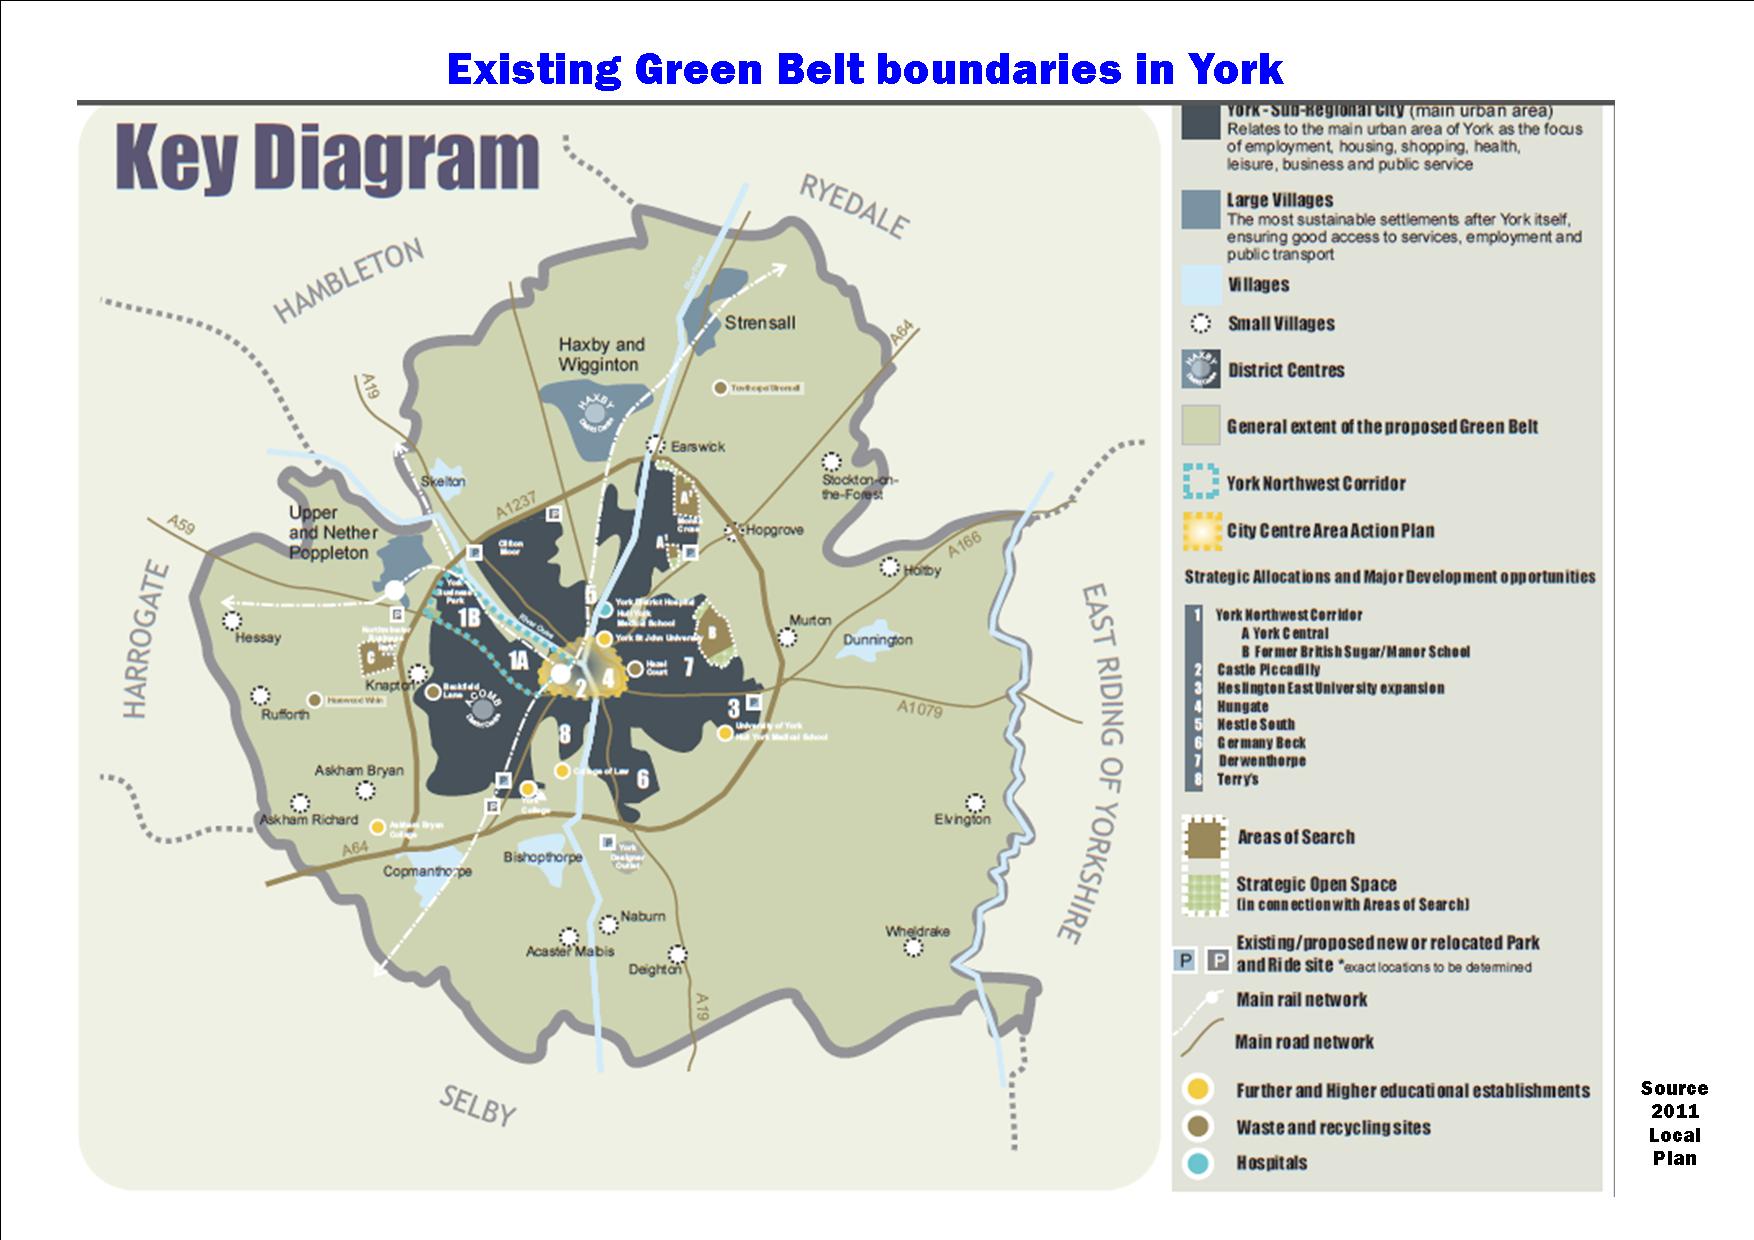
This Order makes use of those powers to partially revoke the regional strategy for Yorkshire and Humber, which comprises The Yorkshire and Humber Plan Regional Spatial Strategy to 2026 (“the RSS”) and the Regional Economic Strategy for Yorkshire & Humber 2006-2015. Policies in the RSS which relate to the Green Belt around the City of York are retained. The Key Diagram from the RSS is retained insofar as it illustrates the retained York Green Belt policies and the general extent of the Green Belt around the City of York. The Key Diagram can be found after page 214 of the RSS. A copy can be obtained from the Planning Directorate, Department for Communities and Local Government, Eland House, Bressenden Place, London, SW1E 5DU

So unless and until it is changed the Green Belt around York remains protected.

Existing York Green Belt boundaries. click to enlarge

Existing York Green Belt boundaries. click to enlarge

The protected (draft) Green Belt boundaries are the same as those that Labour Councillors (and others) voted in favour of in the summer of 2011 (see map left)..

The word “draft” only disappears from the description of the York Green Belt when a Public Inquiry has been held and a government Minister has approved a new Local Plan.

In 2012 Labour withdrew the proposed Local Plan from the Public inquiry after doubts were raised about the credibility of the policies contained in it regarding out of City centre shopping facilities (post the Monks Cross planning decision).

The existing Green Belt boundaries continue to be protected.

Labour should stop trying to frighten residents into thinking otherwise.

Lendal bridge closure – new figures cast doubt on Council claims. Drivers face £80 hike in fuel costs

A Freedom of Information (FOI) request has revealed that an extra 300 vehicles an hour will be diverted onto Clifton Bridge, and its approach roads, when Lendal Bridge is closed to cars in August.

This is likely to have a much greater effect on congestion levels than the recently discontinued “on road” cycle lane at Clifton Green.

Lendal bridge traffic volumes click to enlarge

Lendal bridge traffic volumes click to enlarge

The biggest problems are likely to arise between 4:00pm and 5:00pm although the effect on weekend traffic volumes is currently unknown.

The FOI request asked the Council to reveal the forecast hourly volumes of traffic which would cross York’s 6 river bridges both before and after the Lendal closure.

The Council responded with estimates but failed to distinguish between volumes during school holidays and at other times of the year.

It also appears that the model they have used, to inform the Councils decision, could not provide an indication of the increases in average journey times that motorists would face.

The Council did, however, admit that junction queues on Foss Islands Road would add around 2 minutes to an off peak journey.

Further research has revealed that drivers could see their journey times double.

Lendal Bridge closure - extra costs for drivers click to enlarge

Lendal Bridge closure – extra costs for drivers click to enlarge

Those living closest to the City centre will face the longest increase in journey times. They will have to divert to use either the Clifton Bridge or the inner ring road.

It is estimated that a resident who drives from Monks Cross to the Railway Station and back – during the closure period – will incur additional fuel costs of £87 a year as a result of the 5 extra miles that they will complete each day

The Council spent around £300,000 a couple of years ago updating its traffic forecasting model. It is deeply worrying that the model apparently cannot provide more detailed information, about the effects on queue lengths, that a Lendal Bridge closure will have.

Even more worrying is the fact that it appears that the decision to advertise the plan, was taken without those responsible being given figures which indicated the additional time that journeys would take and the costs of the extra mileage that residents would incur.

It is expected that the proposal will be debated again by the full Council at its meeting on 18th July

Adoption numbers in York revealed

A freedom of Information request has revealed the number of children in York who have been adopted in recent years

2012/13 – 14 children adopted

2011/12 – 13 children adopted

2010/11 – 16 children adopted

2009/10 – 9 children adopted

2008/09 – 12 children adopted