Coronvirus York update; 16th June 2020

Deaths and test results

There have been no further Coronavirus deaths recorded at York hospitals

There have been no further positive lab test results in the City. The total figure of 462 has been unchanged now for two weeks.

ONS have now published their updated statistics on causes of death across the country. It can be downloaded by clicking here.  It is subject to further refinement.

The tables cover the period up to 5th June. They reveal a cumulative total of 156 deaths attributed to the virus. There were a total of 1154 deaths in the City during the same period (all causes).

Of the Coronavirus deaths, most occurred in hospital (84) while 62 occurred in care homes. Others took place at home or in a hospice. The highest recorded number of deaths in York care homes in one week was twenty although this had fallen to one during the last recorded week.

Jobs and wages in York

Figures published by ONS last month on wage levels in the city caused a panic with some commentators.

The figures suggested that median wage levels in the City had fallen by 9.4% compared to the previous year.

But had they?

According to ONS gross wages were £384.10. The previous year – on the back of an unlikely 5.6% increase – the median wage had been £423.80?

So had workers really seen a £40 a week drop in earnings?

If so, what went wrong?

Most people seem to have forgotten that the published figures are provisional. The final figures will not be available until later in the year. The figures are based on a sample of returns from employers. The sample size changes. ONS advised caution in using short term figures to demonstrate a trend.

As well as the reduction in wages, the ONS figures also say that the City also saw a drop of 3000 in the number of jobs.  Against the background of a record high (and stable) number in employment in the York, that alone suggests a sampling error.

Looking beyond gross pay, a further breakdown indicates that the fall had mainly been down to a reduction in overtime payments. Given the uncertainty in the market as a result of BREXIT, it would not be surprising if there was a slowing down in economic activity. Less overtime would be an obvious symptom of a more cautious approach to investment

However, the most likely explanation for the blip, is that the figures are just plain wrong!

Source ONS

York Council got housing demand figures badly wrong

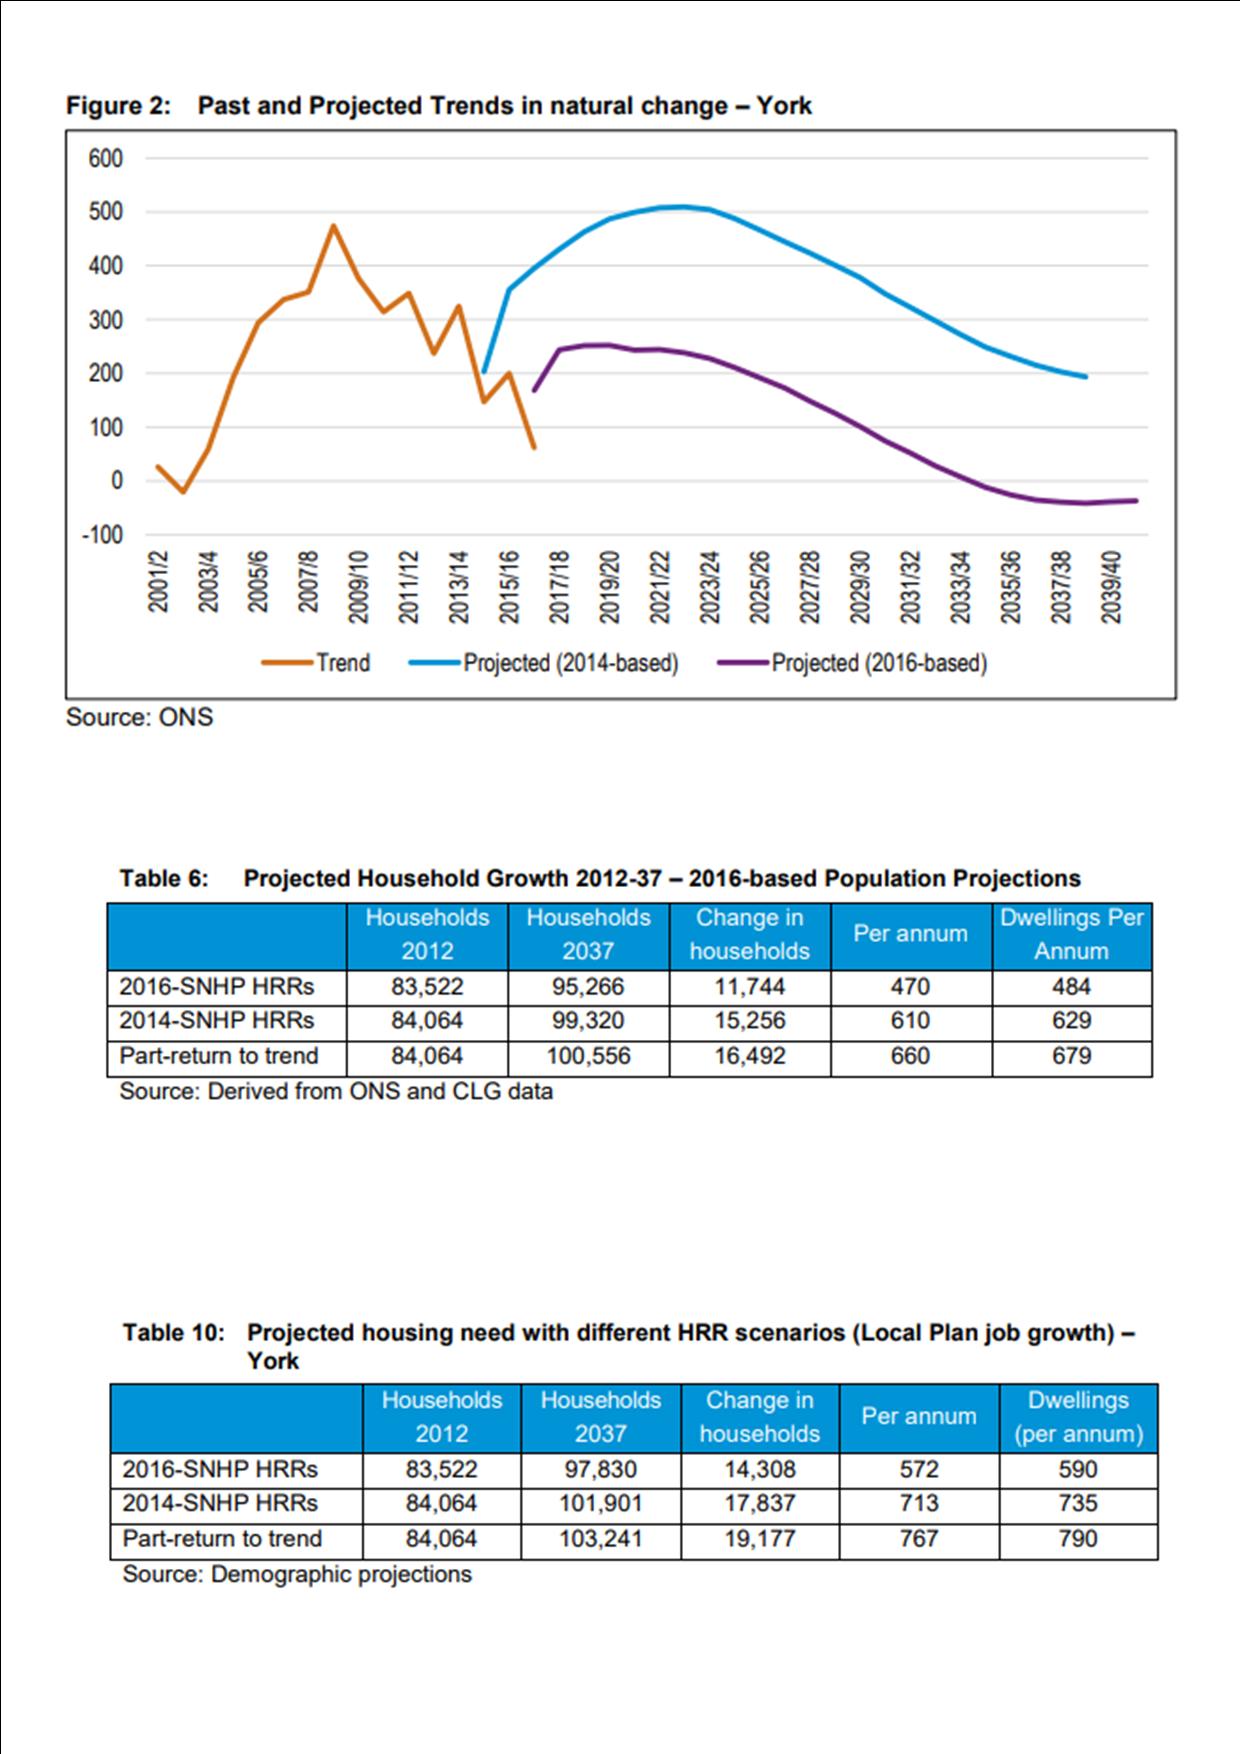
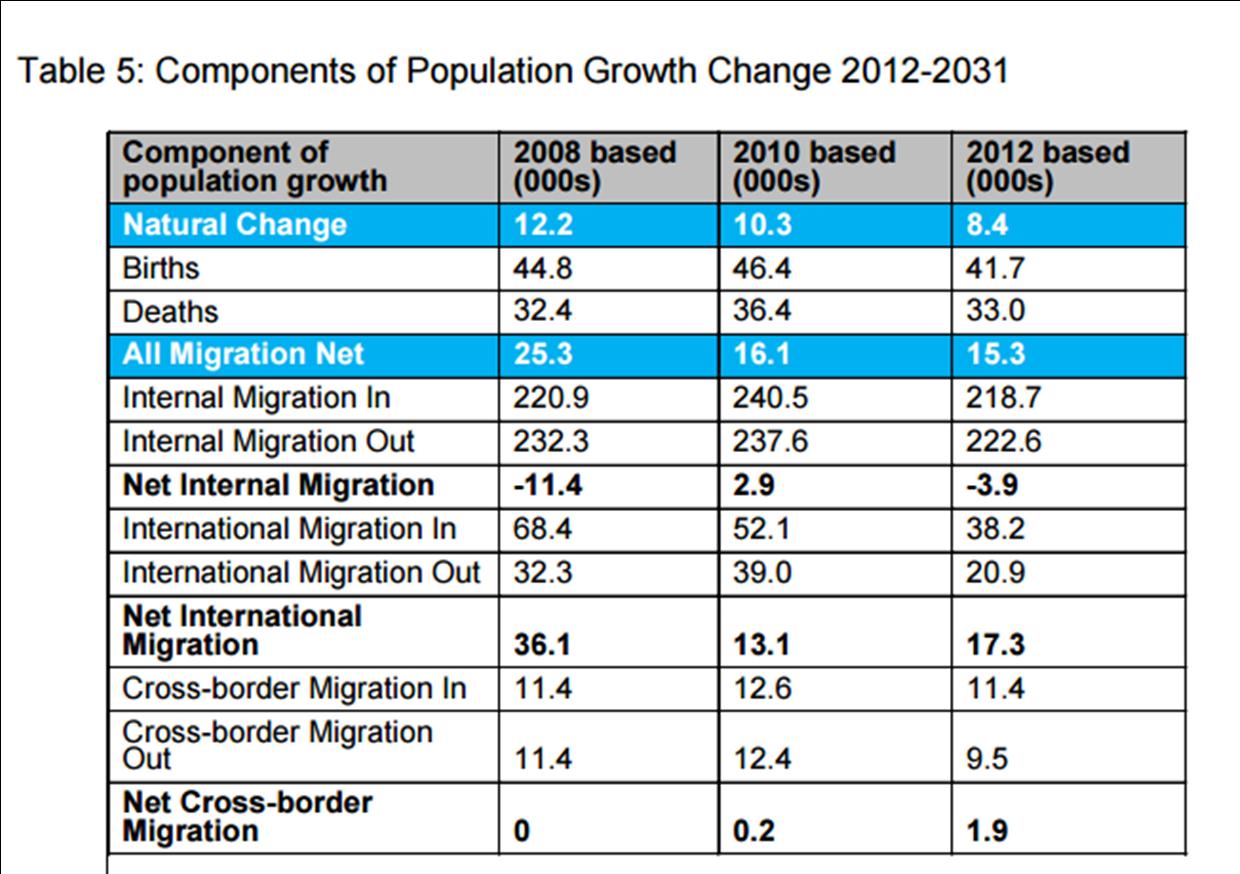
International migration forecast shows substantial reduction

The Council has finally released a consultants report into future house building requirements in the City. It is based on the latest 2016 population forecast produced by the Office of National Statistics

It shows a spectacular reduction on previous forecasts.

The report will be discussed by a Council working group next week, although the new figures have already been forwarded to planning inspectors.

In 2011 a LibDem Council had agreed an annual growth rate of 575 homes.

This was increased to a, wildly unsustainable, 1100 homes by an incoming Labour administration.

An incoming coalition administration in 2015 finally came up with a figure of 867 dwellings a year.

All have proved to be wildly inaccurate.

Unfortunately several green field sites have been lost already because of the muddle. The actual demand could have been catered for comfortably on brownfield (previously developed) sites

The new figures indicate that an additional 470 homes a year will be required in the period up to 2037. A high growth economy could increase this to 590 homes a year.

.. and that is the figure that some commentators have been advocating for the last 8 years and more.

Unfortunately old habits die hard, and the consultants say that, to deflate house prices (and values), a supply of 790 homes a year is required.

Forecast York housing growth figures Feb 2019

Tourist visitor numbers to UK increasing

According to the ONS both the number of people visiting the Uk and UK residents visiting abroad increased during the last quarter of 2016

Overseas residents made 9.2 million visits to the UK in the 3 months to December 2016. This was 6% higher than the same 3 months in 2015.

The amount spent on these visits was unchanged at £5.3 billion.

Visits from North America increased by 15% in the 3 months to December 2016, when compared with the same 3 months in 2015. Visits from residents of EU countries increased by 8% over the same period and visits from residents of other countries (countries other than Europe and North America) decreased by 3%.

In the 3 months to December 2016, overseas residents made 11% more visits for holidays than in the same period in 2015, trips to visit friends and relatives increased by 15%, while business visits decreased by 1%.

UK residents made 14.6 million visits abroad in the 3 months to December 2016, an increase of 8% compared with the same period in 2015. There was a 16% increase in trips to visit friends and relatives, the number of holidays increased by 7%, but business visits decreased by 2%.

The amount spent on visits overseas increased by 15% to £9 billion.

Local Plan: “New” housing land figures released

Big City small

The York Council has released what it claims are new figures intended to quantify the demand for housing development land in York.

The most recent Office of National Statistics population forecasts for the City show a marked reduction compared to the assumptions used when Labour published their version of the Local Plan three years ago.

Their plan to build 23,400 additional homes, mainly to accommodate foreign immigration demand (see table 5), prompted a “Big City or Our City” debate at the last local elections in May 2015. Labour’s ideas were rejected at that poll and the expectation is that the York Council will revert to a more reasonable annual building target of around 575 homes per year

Population increase drivers. Click to enlarge

Population increase drivers. Click to enlarge

Population growth forecasts, produced by the Office of National Statistics (ONS), have reduced dramatically in recent months. They currently show the City’s population growing from 203,000 to 224,000 (approx 21,000 people) between 2012 and 2031.

 With an average of 2.2 people residing at each dwelling, that is equivalent to a requirement for about 500 additional homes each year. To this should be added an assumption about economic growth (which generates  additional housing demand)

The new report will come as a disappointment to many. It fails to examine the capacity of the City to absorb growth without fundamental damage to its character.

 The jargon littered papers conclude that 758 additional homes are required each year.

The report does make some progress on two issues:

  1. It accepts that there is a 5 year supply of land available to satisfy immediate housing demand requirements. The list of sites considered to be available (most already have planning permission) can be found by clicking here
  2. Officials now accept that part – around 140 additional homes pa – of the housing demand will be satisfied from “windfall” opportunities. These are sites which the Local Plan either does not schedule for housing or a combination of very small sites. Most of the planning permissions granted in recent years have been for windfall sites not identified in the 2013 Plan.

The Council seems still to be some way from finding its way through a mass of contradictory evidence.

Most popular names for babies

ONS have issued details of new trends in baby naming.

Messi

Apparently there are an increasing number of Messi’s; thought to be inspired by the footballer although there is some speculation that it might have been an expletive muttered at the wrong time in the registry office.

Game of Thrones queen “Khaleesi ” is an increasingly popular name for girls. How many sovereigns it is possible to have before a war with Wales breaks out, remains to be seen.

Click here http://visual.ons.gov.uk/baby-names/

  • Oliver and Amelia were the most popular first names given to babies born in England and Wales in 2014. Amelia has been in the top spot since 2011 while Oliver has been in top spot since 2013.
  • In England, Amelia was the most popular girls’ name in 8 out of the 9 regions and Oliver was the most popular boys’ name in 7 out of the 9 regions.
  • In Wales, Oliver remained the most popular boys’ name, while Amelia has been the most popular girls’ name since 2012.
  • Lily replaced Mia in the top 10 most popular girls’ names for England and Wales, climbing from number 12 to 9.
  • In Yorkshire the most popular boys names were 
1 OLIVER 
2 JACK 
3 JACOB 
4 MUHAMMAD 
5 HARRY 

The most popular girls names in our region were 

1 AMELIA 
2 ISLA 
3 OLIVIA 
4 EMILY 
5 POPPY 

Full details available click here


New ONS figures highlight housing issues in York

Figures published today by the Office of National Statistics (ONS) confirm that house price inflation in York is outstripping increases in wage levels.

House price trends to 2014

The ratio of median house prices to salary levels now stands at 9.4, the highest ever recorded.

To some extent this reflects a drop in median earnings in the City over the last few years. Media earnings are now £20,648 compared to the peak of £21,130 which was seen in 2010.

House prices started to rise again about 18 months ago and now stand at a median of £194,000 which compares to the 2007 peak of £179,995.

York is the 140th most expensive place to rent a house out of a total of 326 local authorities in England and Wales. 

The average monthly rent is £675, which is  less than Harrogate where the figure is £695 a month.

Scarborough is the sixth lowest place to rent in England (£433 pm) while Hull is the cheapest at £365 pm

A resident, on a median monthly income of £1721, in York could spend 40% of it on renting private accommodation.

Those in social housing fare better with weekly rent levels being £89.87.

85% of housing stock in York is privately owned.

In terms of house building, York has performed poorly over the last 5 years coming 268th out of 326 local authorities.

As a percentage of the existing stock growth rates have been:

  • 2010 0.70%
  • 2011 0.50%
  • 2012 0.34%
  • 2013 0.28%
  • 2014 0.26%

On social housing York has a relatively low shortfall in provision at 13.9% of existing stock compared to most other areas. The worst area is Medway at 239.1%

The statistics suggest that the York Council and its partners have work to do to increase housing supply in the City while also trying to increase relative salary levels.

York has lower than average employment levels – official

The York Central constituency falls below the rest of the country on several measures revealed by the Office of National Statistics today.

click to access

click to access

The proportion of the population in employment (different from the statistics on the numbers claiming Job Seekers Allowance which are normally quoted) is 70%.

This is slightly below the national average.

Other stats include:

  • 84% of residents are in “good health” well above the national average
  • It has fewer people(13%) aged over 65 than the average ranking at 531 out of a total of 632 parliamentary constituencies nationwide.
  • 14% are claiming state pension compared to nearly 19% across the UK
  • The number of business enterprises per 10,000 residents is 267 units well below the national average
  • 7.3% of the population is “non white” which is again below the national average

Click the graphic to access an information map covering the whole country.